I’ve often been contacted by various journalists to comment on different science stories, usually related to Greenland, the ice sheet or more generally glaciers and climate change. This makes sense, I’ve spent the last 20 years studying the interactions between the climate system and the cryosphere.
Last week, I was asked to comment on the record minimum Antarctic sea ice extent (scroll to the bottom to see what I had to say). While sea ice is not exactly my area, it’s pretty close, and I have looked into it in some detail given that I am also part of the ESA Climate change initiative for sea ice.
Update: I just became aware that the ever entertaining and informative Dr Ella Gilbert has a superb video over on youtube which discusses all of this in some detail. She’s far more engaging than I am so I’m just going to drop the link here. You can probably skip the rest of this post..
Last year, whilst working on the sea ice, I had to acknowledge to my sea ice colleagues – it is an awful lot more interesting than I’d originally thought. Probably the moment when I really got it though, was when my colleague Andrea urged me to taste the frost flowers we had just spotted growing next to a sea ice lead, as in this this picture on the left.
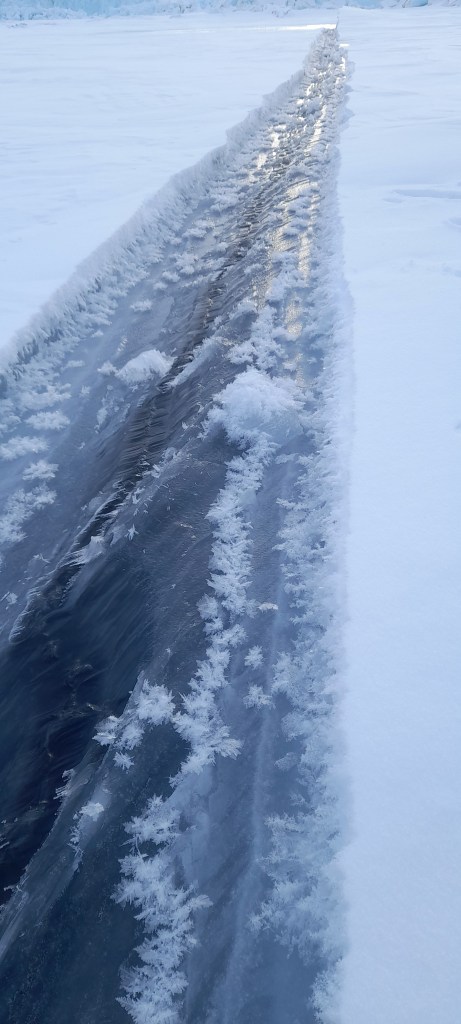
They are delicate, soft, and almost fizzy with salt. How can you not wonder about their formation and wonder about the role of sea ice in the fjord system?
Back to Antarctic sea ice: The current wave of media stories has been about the new record low sea ice area. The annual minimum, reached in February was about 1.7 million km2, or about 1 million km2 less than the average sea ice extent at the annual minimum. As the figure below shows, there is a really clear annual cycle with sea ice growing from February to September, when it reaches it’s maximum, and then declining again to February the following year when it reaches a minimum extent.
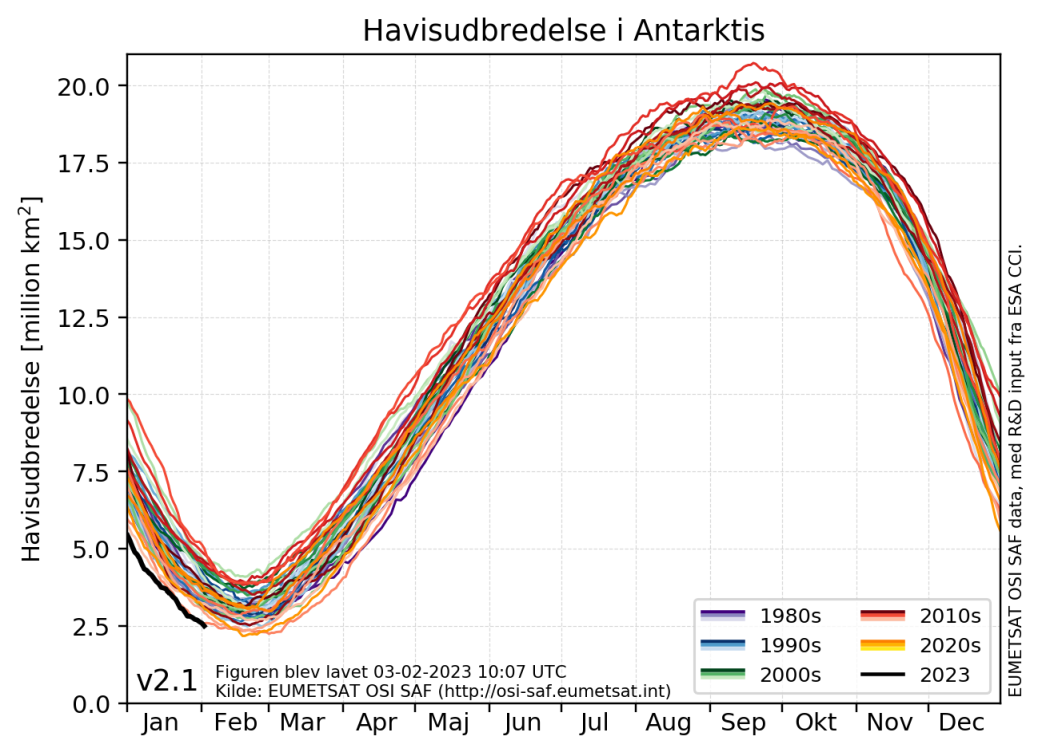
This pattern is pretty similar to the Arctic where the sea ice has a maximum area in Feb/March and a minimum area in September.
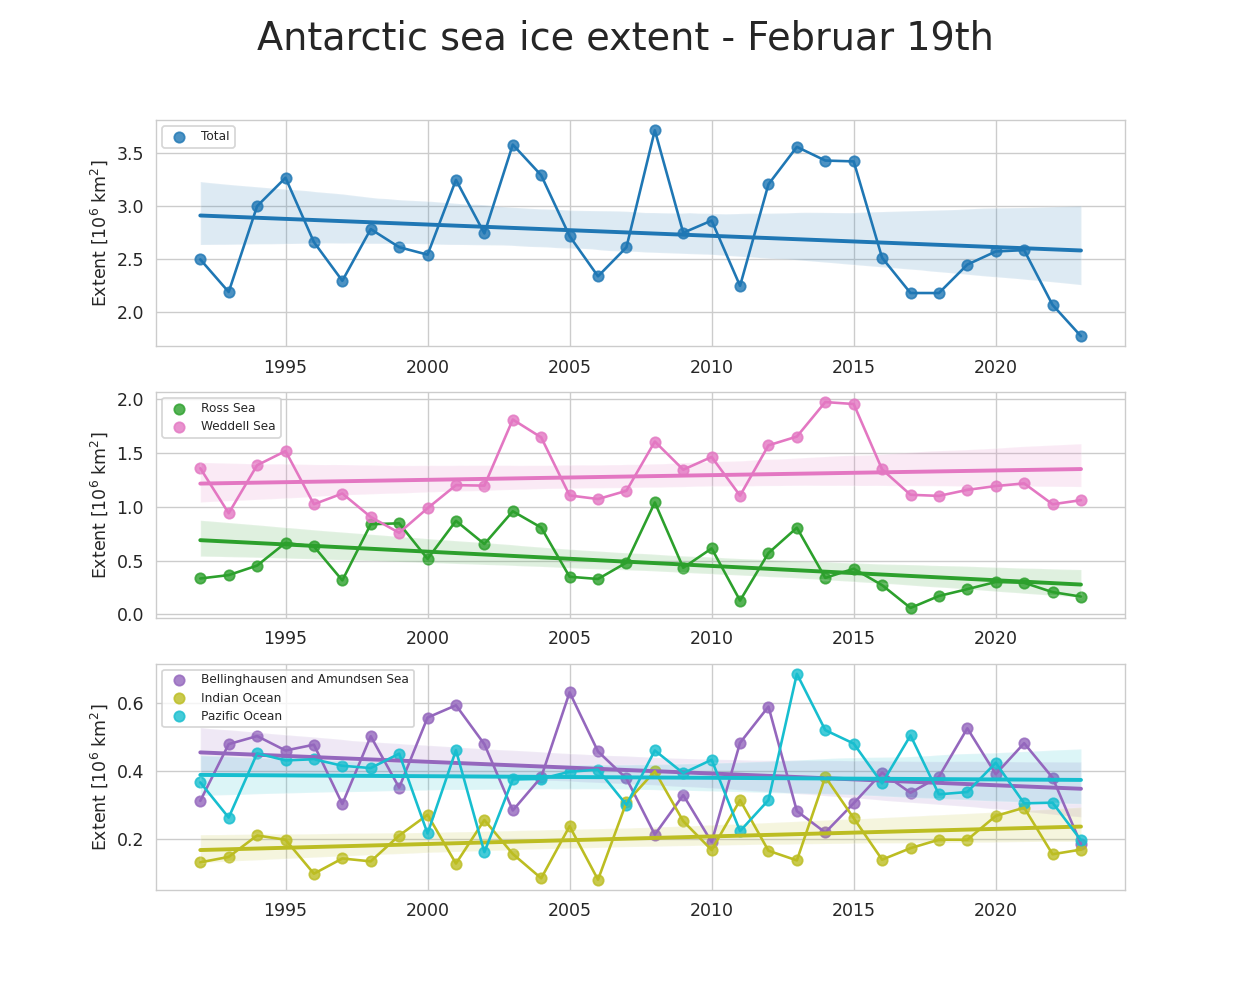
If you sum this whole area around Antarctica up to one number per year, there is no clear trend – in fact until 2016, Antarctic sea ice appeared to be increasing, in direct opposition to the Arctic area which has crashed over the last 30 years. Then things have changed.
The figure below, plotted by my colleague Gorm Dybkjær and presented at the Danish Antarctic science seminar clearly shows this. Blue colours indicate above average sea ice area, red colours below average.

However, as many others have also pointed out, although the overall trend was increasing up to 2016, that increase largely came from one basin, the Weddell Sea, which in contrast to the Ross Sea, Bellingshausen Sea and Amundsen Sea sectors*, was increasing it’s area covered by sea ice. Now all sectors have seen a decrease.
There are good reasons to be cautious interpreting these changes. Antarctica is a big place. There is a lot of climate variability and some of the patterns we know are pushing will affect different parts of the continent in opposite directions.
I tried to get this across in the clip below. Let me know if you think I succeeded…
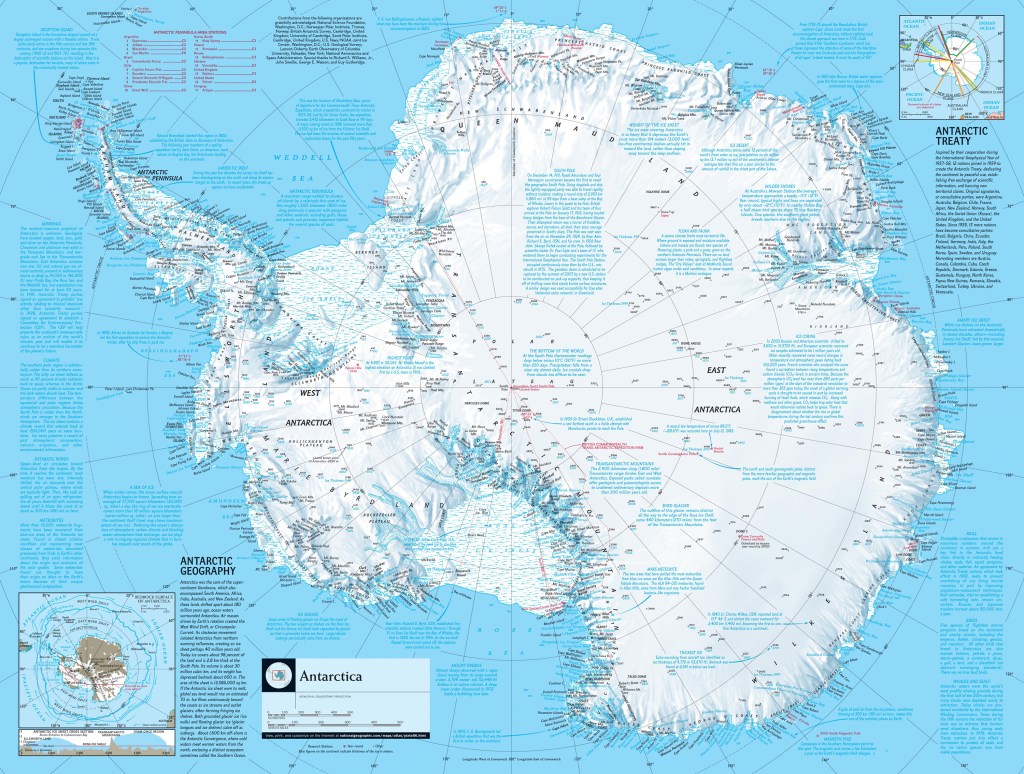
*Yes I know it’s confusing. Maybe this National Geographic Map helps?

One thought on “Low Antarctic sea ice”