Rain rain go away…

My 2 kids were singing the rain rain go away rhyme during last weekend’s epic rainfall in Copenhagen and it reminded me that I have not yet put up a post about a paper I was a co-author on this summer related to late summer/autumn rainfall and the effects on the Greenland ice sheet, so here goes….

Mostly when we think of precipitation in Greenland we think of snow in the winter, but it does rain quite a lot, as I know from personal experience (see photo taken as the clouds started to clear one September field season in Eastern Greenland…). This paper in Nature Geoscience by Sam Doyle and co-authors including myself shows that when rain falls on the ice sheet at the “wrong” time of year it can have a very far-reaching effect, causing the speed up of a large area across the ice sheet.

Rain clouds over the Stauning Alps of Eastern Greenland after the third day of rain... Exploratory mining camp tents in the foreground.
Rain clouds over the Stauning Alps of Eastern Greenland after the third day of rain…
Exploratory mining camp tents in the foreground.

The important caveat is that rainfall during the main part of the melt season is more or less evacuated away quickly. Glaciers – and the Greenland ice sheet is basically a very big glacier – develop a drainage system more or less analogous to large underground sewers during the melt season. These tend to close down during the colder accumulation season and reopen by the sheer pressure of water running through them when the melt season starts. Rainfall during that crucial late summer/early autumn period when the drainage is closing down and therefore less efficient at evacuating surplus liquid water is therefore not able to move away from the glacier very easily and forces its way through any way it can find.

During this period, most of the snow will have melted off the surface, leaving vast areas of bare ice. By contrast, rain on snow in the early part of the melt season when there is a thick snow pack is more likely to refreeze inside the snow. In late summer however, there will be a relatively short period between rain falling and accumulating in the glacier drainage system.

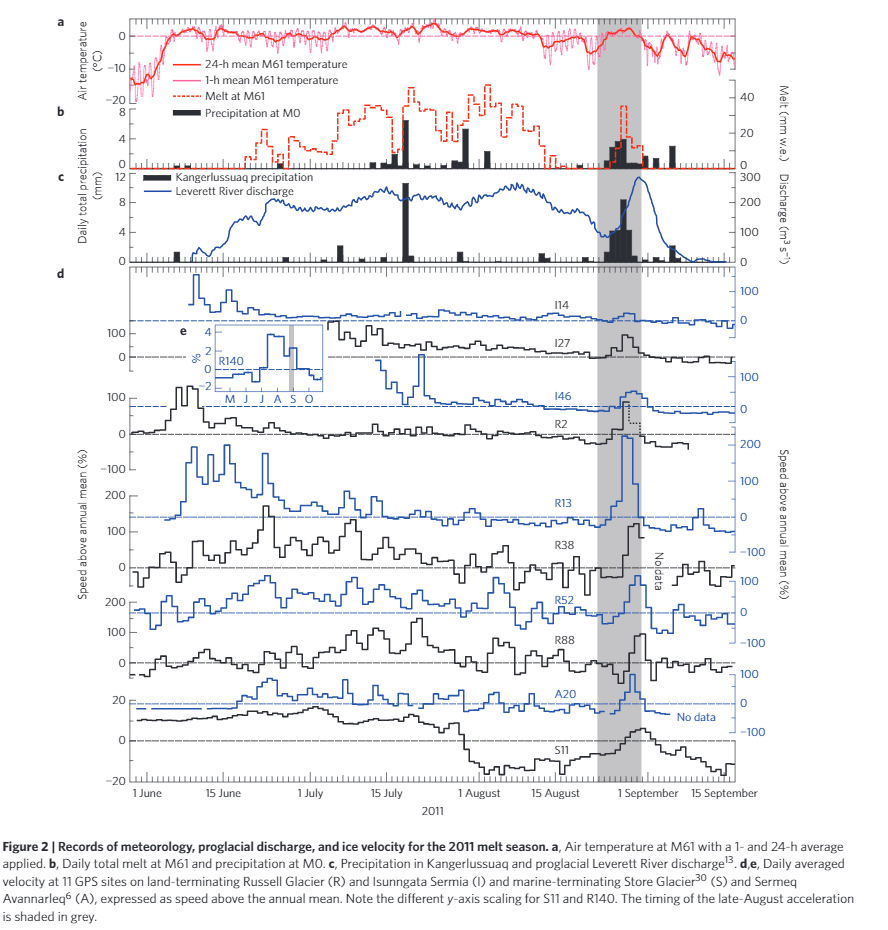
In practice this means the water makes its way to the bed of the glacier through moulins and englacial channels, where it more or less hydraulically jacks up the glacier over a large region, allowing the ice to flow to the margins faster. There may then also be a knock-on effect with increased calving of icebergs at outlet glaciers. in 2011, the field team were able to measure both the rain fall and the following cascade of processes in a range of different datasets as shown below:

Rainfall (a,b) over the ice sheet runs off the bare ice quickly as shown by discharge stations on a number of rivers in western Greenland (c). This triggers acceleration  across a wide area, shown by GPS stations on the ice sheet at 10 different locations (d). Figure taken from the paper
Rainfall (a,b) over the ice sheet runs off the bare ice quickly as shown by discharge stations on a number of rivers in western Greenland (c). This triggers acceleration across a wide area, shown by GPS stations on the ice sheet at 10 different locations (d). Figure taken from the paper

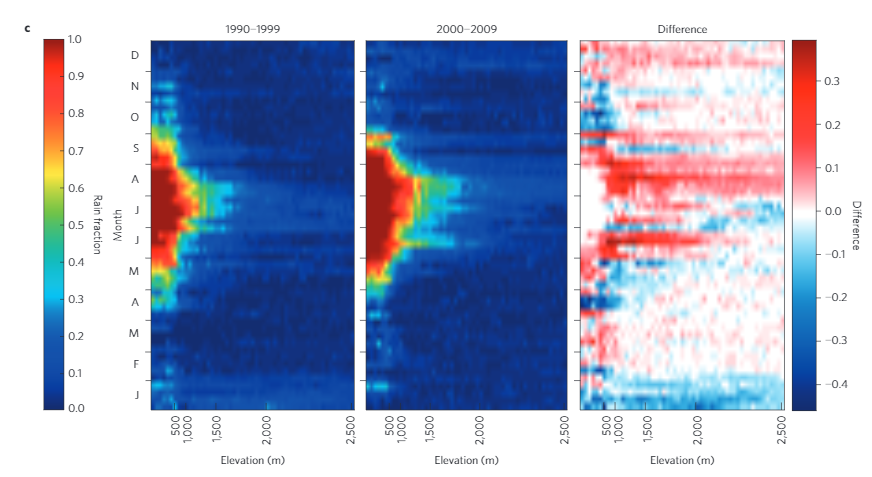
My contribution to the paper was in the form of some HIRHAM5 model runs for Greenland which show the last decade has seen a significant increase in rainfall events in the summertime compared with the previous decade. We chose as a study region the K-transect of weather stations in western Greenland. These are operated by Utrecht University and have a long time-series of data which previous work has shown our model can replicate quite nicely. The model is forced by the ERA-Interim reanalysis, a data set based on weather forecast models with real observations included in it run for the whole world so we are pretty confident the rainfall patterns are realistic. There are actually two interesting points illustrated in the picture below taken from the paper. Firstly that there is more rain falling and secondly that this rain is falling at higher elevations on the ice sheet, potentially causing a much wider area of the ice sheet to be affected by late-summer rainfall events.

The decadal change in rainfall events is partly due to a persistent North Atlantic Oscillation anomaly which has funnelled storms over the western edge of the ice sheet. There is also some evidence that the stratospheric Rossby waves have become more “wavy” over the same period, due to the increasing warming and vanishing sea ice in the Arctic. This hypothesis was articulated in a very nice paper by Francis and Vavrus but it remains a very open area of research as we just don’t have a lot of evidence right now.

We do know that the Arctic is one of the fastest warming regions on the planet and this will certainly have a knock-on effect on the Greenland ice sheet both in terms of melting and, perhaps, in the frequency of storms bringing rain over the ice sheet in the future. I am now preparing a new study to see if we see a signal along these lines in our future simulations of the Greenland domain.

Rainfall events at a weekly timestep over the K-transect in western Greenland  for two different decades and the difference between the two. The second decade has many more rainfall events that reach to a much higher elevation than the first decade.
Rainfall events at a weekly timestep over the K-transect in western Greenland for two different decades and the difference between the two. The second decade has many more rainfall events that reach to a much higher elevation than the first decade.

Conversion Factors

The official end of the hydrological year in Greenland (1st September to 31st August) means I am rather busy writing reports to give an overview of where the ice sheet is this year and what happened. I will try to write a quick blogpost about this in the next week or so (in case you’re curious here’s a quick plot to show the entire annual SMB, see also: http://polarportal.dk/en/groenlands-indlandsis/nbsp/isens-overflade/)

Daily and accumulated surface mass budget of the Greenland ice sheet, 31st August, 2015, last day of the hydrological year
Daily and accumulated surface mass budget of the Greenland ice sheet, 31st August, 2015
Anyway, as I find I am constantly switching between Gigatonnes (or indeed Gigatons), cubic kilometres and sea level equivalent, here is a quick and handy guide to converting different units of mass, for my own use as much as anyone else.

1 gigatonne is 1 billion metric tonnes  (or 1 milliard if you like the old British style, that is one thousand million).

However, on the Polar Portal we usually reckon everything in water equivalent. This is to save having to distinguish between snow (with a density between ~100 kg/m3 when freshly fallen and ~350 kg/m3 m when settled after a few days), firn (snow that has survived a full annual cycle with a density up to ~800 kg/m3) and glacier ice (anything from ~850 kg/m3 to 900+). Water has a density (at 4C) of 1000 kg/m3

1 gigatonne of ice will still weigh 1 gigatonne when it is melted but the volume will be lower since ice expands when it freezes.

1 metric tonne of water is 1 cubic metre and 1 billion metric tonnes is 1 km3 (a cubic kilometre of water)

A cubic kilometre of ice does not however weight 1 gigatonne but about 10% less because of the density difference.

100 gigatonnes of water is roughly 0.28mm of sea level rise (on average, note there are big regional differences in how sea level smooths itself out).

Finally, 1 mm sea level rise is 360 Gt of ice (roughly the number of days in a year) 

EDIT: – thanks to ice sheet modeler Frank Pattyn and ice core specialist Tas van Ommen on Twitter for pointing out I’d missed this last handy conversion. Interestingly and probably entirely coincidentally this is very close to the amount of mass lost by the Greenland ice sheet reported by Helm et al., 2014 for the the period January 2011 – January 2014 (pdf here) of 375 +/-24 km3 per year.

Over the last 10 years or so, Greenland has lost on average around 250 Gigatonnes of ice a year (Shepherd et al., 2012), contributing a bit less than a millimetre to global sea level every year with some big interannual variability. This year looks like it will be a comparable number but we will have to wait for the GRACE satellite results in a couple of months to fill in the dynamic component of the mass budget and come up with our final number.

Of course, gigatonnes and cubic kilometres are rather hard to visualise so we have skeptical science to thank for this post that tries. And as aside, Chris Mooney wrote a nice piece in the Washington Post on the difficulties of visualising how much ice is being lost which contains the immortal  line “Antarctica is clearly losing billions of African elephants worth of ice each year”.