Mining for (data) gold

UPDATE: I don’t really touch on the issue of availability of data in this post but a post by Victor Venema has just come to my attention urging the WMO to agree a free data convention to free up climate data archives for science purposes. I urge you to read it and support. In Greenland at least we are lucky most of the data is open access, but we also rely on other data sources that are not…

One of the problems all modellers face, but particularly in remote regions of the earth like Greenland, is the lack of available independent observational data which can be used to compare with model output to see how well the model simulates reality.

Compariosn between modelled and observed monthly mean temperatures for Danmarkshavn using DMI automatic weather station data and HIRHAM5 model output
Comparison between modelled and observed monthly mean temperatures for Danmarkshavn using DMI automatic weather station data and HIRHAM5 model output
Comparison with Promice KPC_U station observations and HIRHAM5 modelled monthly mean temperatures

I actually spend much more time trying to model the recent past (say the last 35 years or so, almost my whole lifetime), rather than the future. We can compare the model output with specific metrics to assess if the model is representing any particular processes well or poorly. If the latter then clearly we need to do a bit of work to improve it, or alternatively we can gain an insight into how a particular process or system works. This is a gigantic topic to explore and I recommend the blogs Variable Variability from Victor Venema and the Climate Lab Book from Ed Hawkins and Doug McNeall if you really want to get into it.

(As an aside and related to my previous post, I generate model output faster than I can look at it, so any students who are interested in a project looking at observations and model output for any/all of various locations in the Arctic do get in touch. I have some particularly interesting results from Devon Island I don’t really have time to get into right now…)

Image of Devon Island from the Canadian Encyclopedia

At a recent meeting in Sheffield we had much discussion on using data from Greenland to evaluate how well the different climate models are performing over Greenland. This is complicated by the generally short records and limited geographical coverage of meteorological observations. Often those observations are made in easy to get to places rather than the places we really need them such as the South East of Greenland where most of the precipitation falls. So here is a quick run down of the met observations I do have access to.

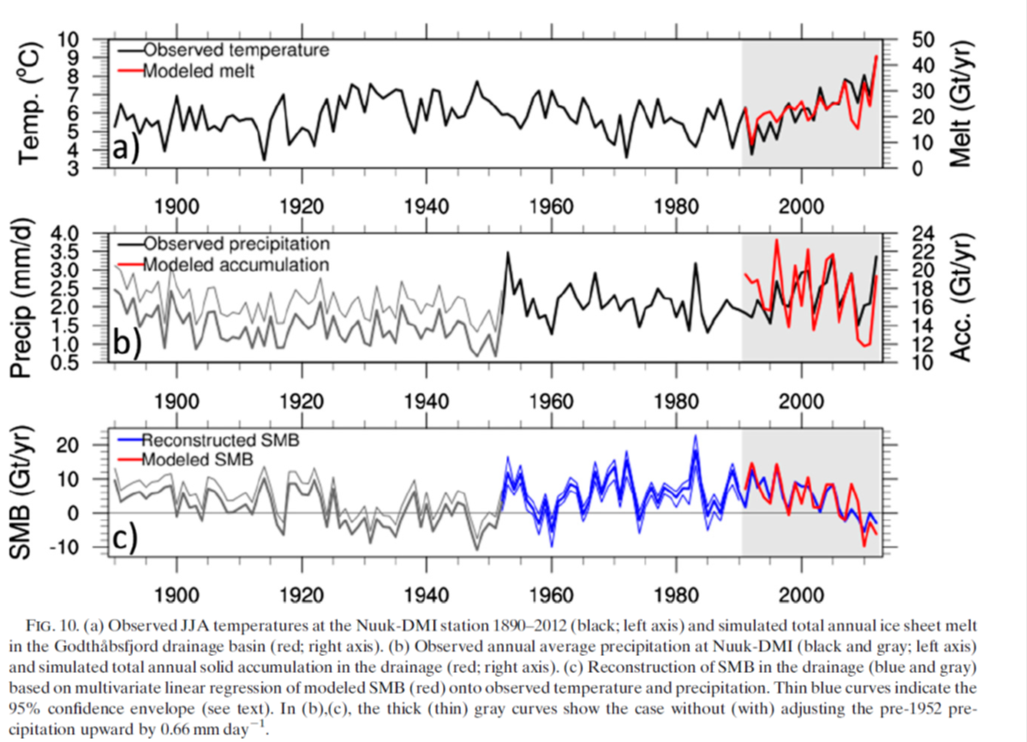
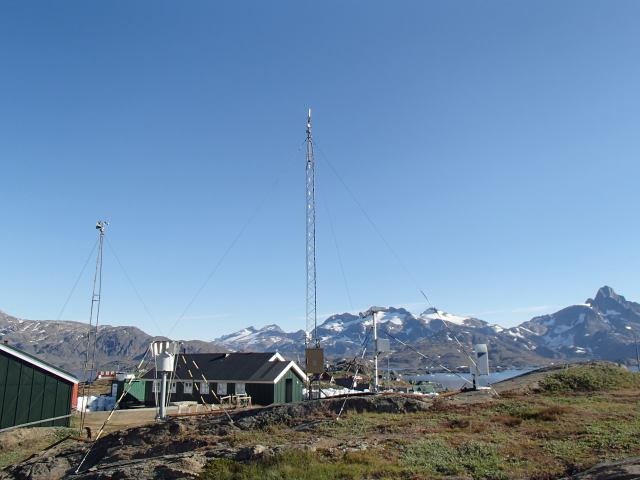
The gold standard of met observations, following guidelines set by the WMO, are the DMI weather stations (pdf ) which are largely confined to the coast of Greenland, plus Summit station at the top of the ice sheet, but have records going back, in some cases, to the 18th century. This data is all publically available and can be downloaded in a zip file from DMI.

Henrik Krøyer Holm weather station in Northern Greenland. It's very expensive to maintain so it is visited only once every 3 years or so. Like most instruments in Greenland, it is built to be tough. Picture from DMI archive
Henrik Krøyer Holm weather station in Northern Greenland. It’s very expensive to maintain so it is visited only once every 3 years or so. Like most instruments in Greenland, it is built to be tough. Picture from DMI archive

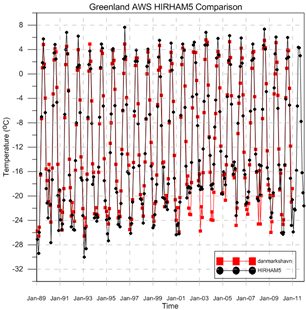
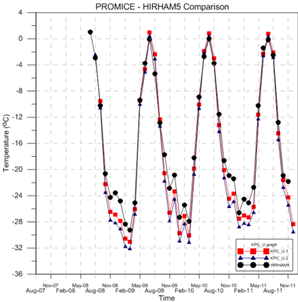
On the ice sheet itself the GC-Net project has set up automatic weather stations on the ice sheet. This data is also pretty freely available, but it does have some quality problems as with any dataset from instruments operating in incredibly tough environments. These instruments are high up on the ice sheet in the accumulation zone, more recently the Danish funded PROMICE project, with whom I work quite closely, have been putting automatic instruments out in the ablation zone. Although these instruments are lower the conditions are also quite tough as the snow and ice under the stations melts out each summer and in some locations the piteraq is also very challenging with 150km/h wind speeds measured during one storm in 2013.

Weather station in Tasiilaq, one of the longest records in Greenland and in one of the most data sparse regions. Image from DMI archive

The data from Promice goes back only to 2008 but has been quality checked and homogenised so it is much easier for modellers like me to work with and it comes from a zone that is particularly important to understand. As the climate changes we expect the ablation zone to get bigger and melt to increase with some important but difficult to model processes such as retention and refreezing and albedo changes playing a big role in how quickly the Greenland ice sheet will contribute mass to the oceans.

There are of course also a number of other automatic weather stations operated by other projects and agencies, including the K-transect instruments, operated by University of Utrecht IMAU which are also associated with a long time series of mass balance measurements based on stakes drilled into the ice sheet.

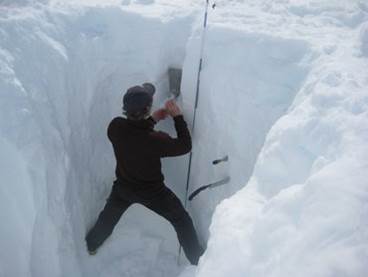
For precipitation measurements, which are notoriously difficult to make especially with blowing snow, we tend to rely on shallow cores and snow pits, though again these are only available in the accumulation zone. This open access paper by our friends at the University of Copenhagen‘s Niels Bohr Institute is a very nice summary of all the measurements available. Unfortunately there are very few shallow cores taken after 2000 and even fewer taken where we need them in the south east.

Promice scientist measuring snow density in a snow pit in southern Greenland
Promice scientist measuring snow density in a snow pit in southern Greenland taken from this piece on fieldwork on the polarportal

I will end with a plea: all of these measurements are made possible only with budgets that have a continuous downward pressure on them. We rely on them for the weather forecast and for climate research, if you use any of this data do remember to acknowledge it. A lot of time effort and money has gone in to making those measurements, once a station is removed it’s pretty hard to get it back again. When the DMI stations were set up no-one was really thinking of climate change, they were more concerned with shipping and later on aviation and yet we now find them some of the most valuable datasets we have making measurements in a very data-poor region, the Arctic. That is true data gold.

Calling all students…

I’m off to the UK next week for a workshop at Sheffield University where we will discuss the Surface Mass Balance of the Greenland Ice Sheet. The ISMASS workshop includes all the main modelling groups and observation groups who are involved in assessing surface mass balance in Greenland. I will be representing DMI’s Greenland SMB work there (not an easy task condensing it down to a 20 minute talk!).

In the course of preparing my presentation I have been making plots and figures and really investigating some exciting results. Sadly, I very rarely get the chance to spend time on this these days and I am keen to recruit students to assist in this work. Should any potentially interested students want to discuss this at Sheffield do let me know.

At the risk of spoilers in my presentation, here for example is one showing how different ways of characterising the surface snow pack affects our estimates for surface mass balance, and how the effects of the specific changes can be very different in different years.

Surface mass balance map plots of Greenland
Surface mass balance for the hydrological year (Sep -Aug) ending in 2012 and 2013 calculated using HIRHAM5 with 2 different surface schemes. The maps on the right show the difference between the 2.

As I mentioned I rarely get enough time to analyse the output from our runs and I would be very happy to hear from any students who are interested in doing a project on our simulations. We have lots of MSc and Bachelors projects already listed on our website at DMI but we are always happy to hear new ideas from students on related topics. I have terabytes of data from simulations I would like to be properly analysed and this could be very interesting given we are talking about Greenland and the Arctic in the present day and in the future. It’s a really nice opportunity to work with some cutting edge research. I am also happy to hear from students who would like to do a summer project and for the right candidate I would be able to look into a paid “studentmedarbejderhjælper” position for a few months, especially if you are already a trained computer science candidate….

If you are an undergraduate looking into an MSc, I urge you to consider Denmark. EU citizens usually qualify for generous support grants (rare these days!) as we have a shortage of candidates wanting to study in the sciences in Copenhagen. The research and teaching are world class and done in English at MSc level. The possibilities for projects in Greenland are literally endless.

If you want any more details or to talk about any of the possibilities, do get in touch!

Changes in SW Greenland ice sheet melt

A paper my colleague Peter Langen wrote together with myself and various other collaborators and colleagues has just come out in the Journal of Climate. I notice that the Climate Lab Book regularly present summaries of their papers so here I try to give a quick overview of ours. The model output used in this run is available now for download.

The climate of Greenland has been changing over the last 20 or so years, especially in the south. In this paper we showed that the amount of melt and liquid water run off from the ice sheet in the south west has increased at the same time as the equilibrium line (roughly analogous to the snow line at the end of summer on the ice sheet) has started to move up the ice sheet. Unlike previous periods when we infer the same thing happened this can be attributed to warmer summers rather than drier winters.

Map showing area around Nuuk
The area we focus on in this study is in SW Greenland close to Nuuk, the capital. White shows glaciers, blue is sea, brown is land not covered by ice.

We focused on the area close to Nuuk, the capital of Greenland, as we had access to a rather useful but unusual (in Greenland) dataset gathered by Asiaq the Greenland survey. They have been measuring the run off from a lake near the margin of the ice sheet for some years and made this available to us in order to test the model predictions. This kind of measurement is particularly useful as it integrates melt and run-off from a wider area than the usual point measurements. As our model is run at 5.5 km resolution, one grid cell has to approximate all the properties of a 5.5 km grid cell. Imagine your house and how much land varies in type, shape and use in a 5.5 km square centred on your house and you begin to appreciate the problems of using a single point observation to assess what is essentially an area simulation! This is even more difficult in mountainous areas close to the sea, like the fjords of Norway or err, around south west Greenland (see below).

Represent this in a 5.5km grid cell, include glacier, sea and mountain...  Godthåbsfjord near Nuuk in August
The beautiful fjords near Nuuk. Represent this in a 5.5km grid cell…

The HIRHAM5 model is one of very few regional climate models that are run at sufficiently high resolution to start to clearly see the climate influences of mountains, fjords etc in Greenland, which meant we didn’t need to do additional statistical downscaling to see results that matched quite closely the measured discharge from the lake.

Graph comparing modelled versus measured discharge as a daily mean from Lake Tasersuaq near Nuuk, Greenland. The model output was summed over the Tasersuaq drainage basin and smoothed by averaging over the previous 7 days. This is because the model does not have a meltwater routing scheme so we estimated how long it takes for melt and run-off fromt he ice sheet to reach this point.
Graph comparing modelled versus measured discharge as a daily mean from Lake Tasersuaq near Nuuk, Greenland. The model output was summed over the Tasersuaq drainage basin and smoothed by averaging over the previous 7 days. This is because the model does not have a meltwater routing scheme so we estimated how long it takes for melt and run-off from the ice sheet to reach this point.

We were pretty happy to see that HIRHAM5 manages to reproduce this record well. There’s tons of other interesting stuff in the paper including a nice comparison of the first decade of the simulation with the last decade of the simulation, showing that the two look quite different with much more melt, and a lower surface mass balance (the amount of snowfall minus the amount of melt and run – off) per year in recent years.

Red shows where more snow and ice melts than falls and blue shows where more snow falls than is melted on average each year.

Now, as we work at DMI, we have access to lots of climate records for Greenland. (Actually everyone does, the data is open access and can be downloaded). This means we can compare the measurements in the nearest location, Nuuk, for a bit more than a century. Statistically we can see the last few years have been particularly warm, maybe even warmer than the well known warm spell in the 1920s – 1940s  in Greenland.

Graphs comparing and extending the model simulation back in time with Nuuk observations

There is lots more to be said about this paper, we confirm for example the role of increasing incoming solar radiation (largely a consequence of large scale atmospheric flow leading to clearer skies) and we show some nice results which show how the model is able to reproduce observations at the surface, so I urge you to read it (pdf here) but hopefully this summary has given a decent overview of our model simulations and what we can use them for.

I may get to the future projections next time…