Forecasting the weather part 1: Differences between forecasts

This is the first part of an occasional series that I intend to write about why it’s so difficult to forecast the weather. In the UK the forecast can be notoriously wrong but it seems to me that most people have no idea how difficult it is to make a good forecast, especially in a maritime climate with air masses coming from all sides. This first piece is based on something I wrote for an online forum when another forumite complained that there were two different forecasts for their area that never seemed to agree.

The divergence between two weather forecasts for the same area over the same period can actually come from a whole range of differences between the different forecasters. In Europe most forecasters use the same observational dataset provided by the European Centre for Medium Range Weather Forecasting (ECMWF). This cuts out one set of problems as weather is famously chaotic and very small changes in starting conditions can lead to big changes in outcome, otherwise known as the butterfly effect. The famous storm of 1987 which destroyed millions of trees in southern England and caused millions of pounds of damage but which was not forecast accurately turns out to have been a super unpredictable event as shown in this talk given at the American Geophysical Union in San Francisco in December 2010. However, chaos theory is fascinating in it’s own right so perhaps I’ll give it a post to itself another time.

In day to day forecasts, the biggest difference is probably in the resolution of the model (if you imagine that an area, say the UK, is divided up into little squares, the computer model solves a whole lot of equations for each square).
If the square is 5km by 5km in size then some processes, and a lot of the topography will be smoothed out, but if the square is 500m by 500m then a lot more will be captured. Imagine a hill of 1000m rising out of a flat plain only 100m high in a particular location. The elevation of the square is the average of the whole elevation. In the 5km by 5km model, the entire hill and an equal area of plain is captured so in the square the average elevation may be 500m, but in the 500m by 500m model it may need 4 squares to accurately cover the hill alone and each square will have a different elevation.

Temperatures typically go down as you go higher, and rain will fall as the air cools, so if the hill isn’t “resolved” in the model the prediction may be unrealistically warm and dry. This is why forecasters like high resolution models, but that resolution comes at a high cost, because you need to increase the vertical resolution (the number of squares in the atmosphere) and reduce the length of time between each calculation as the horizontal resolution increases.

Another source of difference are the actual equations solved in the model. These can be formulated in different ways and with different approximations and are often “tuned” so a model that works really well in Scotland is unlikely to be so successful in the Sahara (where I imagine forecasting is actually pretty easy – it’ll be hot and sunny). That’s not to say the models are “wrong” just that they perform better in some circumstances than others and are designed for different purposes often.

Finally, a further important difference is the updating of the model with real time observations and at the boundaries. Most models are not run for the whole wold, but only a small portion (the whole world can be run at a resolution of about 20km nowadays, but it takes a lot of very expensive computer power). More effective is running a small section (say the UK), and telling the computer what is happening at the edges of the box based on satellite and ground observations. These can also be fed in to the area within the model to nudge it in the right direction. In practice as I mentioned earlier, in Europe most national agencies get this information from a single source, the ECMWF. Also, the models tend to be “better” than the observations (as measurements can go wrong, instruments might be wrongly calibrated etc), so at any given moment a weighting of about 40% is applied to observations and 60% for the model, depending on what in particular you’re looking at.

So the accuracy of any forecast depends on where you live and also how far in the future you need your weather to be reliable. Most forecasts aren’t bad up to 3 days in advance in general terms but the specifics can change quickly. Beyond that to 5 days is more tricky and depends on the large scale situation, for example is there a stable high pressure dominating or a series of storms and which way will a weather system move. Beyond a week to 10 days the forecasters are basically just guessing (at least in a maritime climate like the UK) and this why the met office has recently discontinued seasonal forecasts as they can be very unhelpful.
Garden birds

Female blackbird on a tree branch
Female blackbird waiting for food

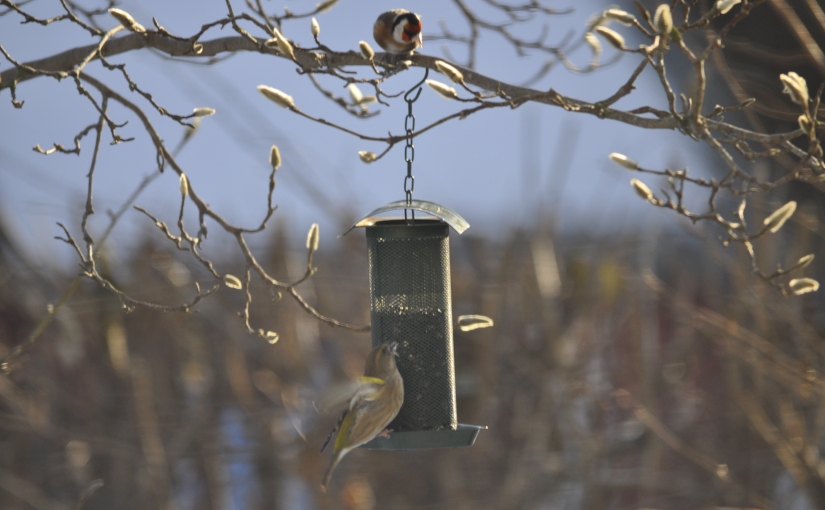
At this time of year about the only thing worth going out into the garden for is to watch the birds. Even in the centre of town where the Sterna nest is located, we have identified 22 different species in the back garden (in no particular order: blackbird, starling, fieldfare, jay, redwing, robin, house sparrow, hedge sparrow, wren, greenfinch, goldfinch, chaffinch, bullfinch, hawfinch, willow warbler, great tit, blue tit, greater spotted woodpecker, magpie, crow, collared dove and pigeon).

As we try to garden for wildlife we’ve left seedheads on plants and I have sacrificed my winter brassica crop to the bloody pigeons (next year I will net them). We have bird feeders for fat balls, seed mix and sunflower seeds and we have also been putting out apples for species such as blackbird and fieldfare. Given the large numbers of birds we’re attracting, it’s no surprise that we have to replenish the food supplies every day or two, especially in the cold weather. I’m still surprised though at how quickly birds find new sources of food. A few years back when we lived in Scotland we put a nyjer seed feeder up in the back garden to attract goldfinches. I’d never seen a goldfinch there beforehand but within a couple of hours we had a pair feeding from it. It’s a mystery to rank with the famous blue tits learning to open milk bottle tops to get at the cream.

Feeding birds deliberately in our gardens is a pretty recent phenomenon, until large urban populations of humans, largely separated from their agricultural roots, were well established, birds were mainly seen as pests, especially species like sparrows which eat grain. It’s also hard to imagine that many of these species were also seen as a human food source until pretty recently. The masterful Birds Britannica book, informs me that goldfinches were almost hunted to extinction in Britain, being considered a food delicacy in the 19th century.  They were in fact one of the first birds the RSPB had on their list of concern. This is pretty incredible to me. They are extremely beautiful, but very small, not much more than a mouthful each and presumably several were needed in each portion. Its a familiar story, as the introduction of modern agriculture with pesticides and the shortage of weed seeds through the winter must also have taken a toll on goldfinches as on many other species, which now have their strongholds in towns rather than the countryside.

Goldfinch and Great Tit on bird feeder
Goldfinch and great tit on bird feeder

The habit of feeding birds has not only caused a shift in which birds live where, it has also apparently led to some species choosing to overwinter much further north than would otherwise have been the case, since there are now reliable food sources about and of course, a run of milder winters has helped. Given the hazards that many songbirds face abroad, for example Cyprus, where they are still eaten and where 1.4 million were taken this winter, this may perhaps be a good thing

Surprisingly though, a recent research study using radioactively labelled foodstuffs found that, in summer at least, bird food from feeders made up only around 5% of an individual bird’s diet. It appears that they see bird feeders as a sort of chip shop on the way home from the pub kind of food – just for a dip in when feeling peckish and not the main source of nutrition except during periods of food scarcity.

Greenfinch eating sunflower seeds while goldfinch looks on
Greenfinch eating sunflower seeds while a goldfinch looks on from above. Good hygiene is essential to prevent the spread of diseases at feeding stations like this one.

Unfortunately there is a dark side to feeding the birds in our gardens. It has been well known for sometime that birds can contract diseases such as aspergillosis, salmonella and e. coli infections as a result of the close contact that bird feeders necessarily encourage. Since 2005, trichomonosis has become an increasing problem too in the finch population, having apparently jumped species from pigeons and doves. It appears to affect greenfinches and chaffinches in particular, but also affects other species and although occurring mainly in the UK, has also been reported in Norway, Sweden and Denmark. The overwhelming popularity of birdwatching in the UK means that it may well simply be better reported than elsewhere.

Now that the snow has melted and the days are started to lengthen again, our feathered friends are bringing us much joy and even the recently hatched Arctic chick is starting to take an interest in their flutterings about the garden.

Apple halves in the frost
Apple halves left out for the birds in the frost

Let it snow…

I have found myself shovelling a lot of snow this winter. As with last winter, it has been cold and snowy across northern Europe so far, which has led to the usual questioning of climate change by the usual suspects. There is some very good work examining this on the real climate blog and Marcus Brigstocke did his usual amusing best on the Now Show towards the end of last year, so I’m not going to write about the difference between weather and climate, or about how regional and global average temperatures differ. Rather, the time spent shovelling snow and wandering around the city streets camera in hand to take photos, really brought home how many of the snow processes that are subjects of active research in remote or mountainous areas are currently on display in our cities.

For instance, today in the local park I noticed that there is preferential melt occurring around the trees. The dark tree trunks absorb and emit more radiation that then melts snow around the trees faster than it melts in the open areas of the lawn. This is an important consideration in the planting of forests in snowy areas, since the presence of vast forests can significantly alter the albedo of the earth’s surface, that is how much radiation is reflected back in to space. Planting trees in the tundra to combat climate change may have the unintended effect of actually enhancing warming through changes of this kind.

Picture of glacier table - a boulder balanced on a thin stack of ice
Glacier table in Switzerland (Glaciers Online)

The process can also be seen to spectacular effect on glaciers, where rocks and boulders shield the ice below them from melting but enhance it around them, leading to the formation of so-called glacier tables, such as this one in Switzerland (from glaciers online).

More seriously, the heavy snow on rooves around the city is currently posing an avalanche hazard rarely encountered outside the mountains. The effect of sunshine on heavy snow, which is resting on a slope of a critical angle, can be extremely dangerous to the unwary. As are the large numbers of icicles which have developed. These are not just a sign of poorly insulated buildings (where the heat leaking out has caused the snow to melt and then quickly refreeze in the low temperatures we’ve had). Icicles falling from buildings show the same mechanics as seracs falling from the steep parts of glaciers known as ice falls. In this case, the ice builds up to such a degree that the sheer weight of it eventually causes fracture when a critical threshold is reached. Pedestrians are learning to walk on the outside of pavements and to look up frequently at the overhanging cornices of snow and ice.

But back to the snow shovelling. I have not done so much digging since fieldwork last winter in Svalbard, where we set up some experiments to study the properties of snow and how this affects the melt, or conversely the growth, of glaciers. Specifically, we were studying the effects of liquid water from snow melt or rain on the snow pack and the glacier surface. Liquid water filters into the snow, or else runs off bare glacier ice if there is no snow and will typically freeze, forming ice lenses in the snow pack, or large areas of what is known as superimposed ice on the glacier surface.   As you can imagine, there was a lot of snow shovelling, especially as the high winds on the glacier kept filling in the trenches we dug to work in.

Now this probably sounds like a fairly esoteric set of experiments, but the purpose is actually quite serious, since we need to know how much melt water refreezes to work out how much the glaciers and large ice sheets of the world are melting and how sea level rise is likely to progress in the future in a warming world.

Identifying the melt area of a glacier or ice sheet is a relatively straightforward task using satellite imagery, but identifying how much of that melt runs off or refreezes is impossible at present, so we generally use a model, based on observations and experiments like these, to make an approximation. We also need to factor in the effect of latent heat, (heat that is released when liquid water becomes solid ice) since this can warm up the snow pack significantly. In Greenland for instance, it is likely that the effects of higher temperatures over the last 20 years or so have been buffered somewhat by the snow pack and refreezing processes. However, as temperatures continue to increase, melt will probably accelerate partly because the saturated snow pack cannot absorb additional melt water but also because it has a higher temperature from the release of latent heat and thus requires less additional energy to melt.

Last winter I tested out some of the techniques we used in Svalbard, in a pile of snow in my back garden. I am also aware of at least one study into permafrost, where patterned ground usually found in Arctic climates was created in a back garden in St Andrews, so it’s even possible to do valid experimental work during the winter time when conditions are right. However, the climate of glaciated regions is generally unlike that of the cities of Europe so there will still be a need to go to places like Svalbard to do experiments quantifying these kind of processes. Nevertheless, I still find this kind of weather inspiring and I’m hoping to get more insights as the winter progresses.

The Arctic Tern

Sterna Paradisaea is the Arctic tern. This amazing little bird lives around 30 years in the wild and every year completes the longest migration in the world, flying from the Arctic, where it breeds, to the Antarctic to feed. It sees more daylight than any other creature and is not only a great endurance flier but a marvellously agile one, a true aerial acrobat like a marine version of the more familiar swallow. It is also a brave parent, chasing away much bigger animals from it’s ground nesting colonies and braving attacks by skuas and other aerial pirates to feed its young.

It has been my privilege and delight to observe these birds while doing fieldwork in Iceland, Svalbard and Greenland. Some years ago while working out of UNIS in Svalbard, I found a desk in an empty office that overlooked a colony. Over 4 short weeks, albeit of continuous daylight, I was able to watch the spectacular aerial courtship displays, the ultra brief matings, the brooding of eggs, the feeding and raising of young and the eventual fledging of new individuals. I had never known I was a nascent birdwatcher before this.

I have decided to start a blog, partly to share my opinions with the world (and thus avoid boring my long-suffering friends), but mainly to improve my writing by preparing short easy to read pieces in an every day style.  I chose the Arctic tern as a symbol of the wide range of subject areas I want to cover. I also like to think that as scientists we are in a constant chasing of the light, and in my field of climate research especially, trying to evade and chase off predators and pirates.

As a scientist, I often feel I am not very good at communicating with non-scientists and I hope this blog will provide me with some good practice and discipline, and of course I hope it will provide you, dear reader, with some interesting diversion. Please feel free to comment and provide feedback on my subjects and my writing style.