
LISA: the Lightweight In Situ Analysis box is one of a kind; built by our friends at PICE in the Niels Bohr Institute. Later this year we’re taking LISA to Antarctica for the first time ever, to analyse shallow snow and firn cores directly in the field.
This is part of our contribution to the EPIC iQ2300 – a project led by Prof. Arjen Stroeven in Stockholm and organised by the Swedish Polar Research Secretariat.
iQ2300 is a huge project, and we are just a small part of it: the aim is to understand Dronning Maud Land’s evolution from the Holocene and out to 2300. Expect to hear a lot more about this effort in coming months…

Now back to our humble friend.
We hope LISA will help us understand how much snow falls in Dronning Maud Land, how much it varies from year to year and what is the influence of sea ice and far field atmospheric processes on the rate of snowfall. Snowfall is exceptionally difficult to measure and one of our biggest uncertainties in working out Antarctic mass budget and the response of Antarctica to a changing climate (spoiler alert: we might have a paper coming out about this shortly)…
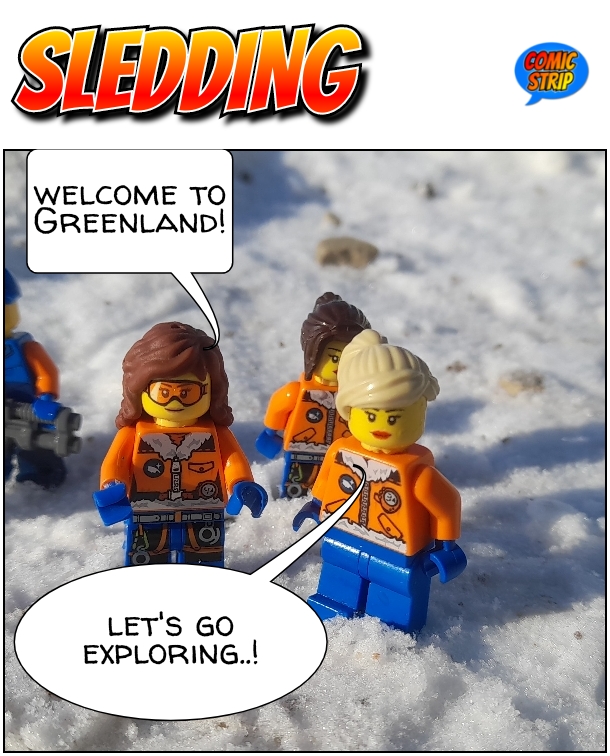
Although LISA has been used in Greenland before, this is quite an experimental deployment, which means potentially really a lot of valuable scientific results. We would ultimately liek to build an Antarctic specific box, but that will have to wait to see if the results of this deployment are as good as we hope. (And some funding – if you are a billionaire with a spare couple of hundred thousand Euros, we’re always interested in talking).
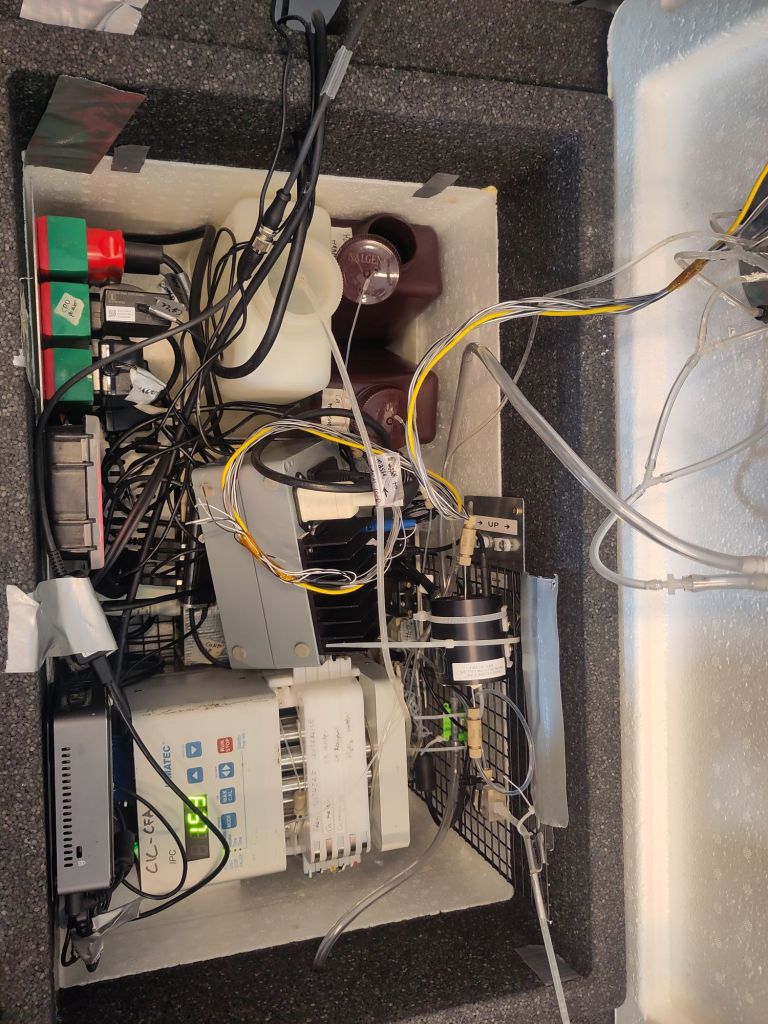
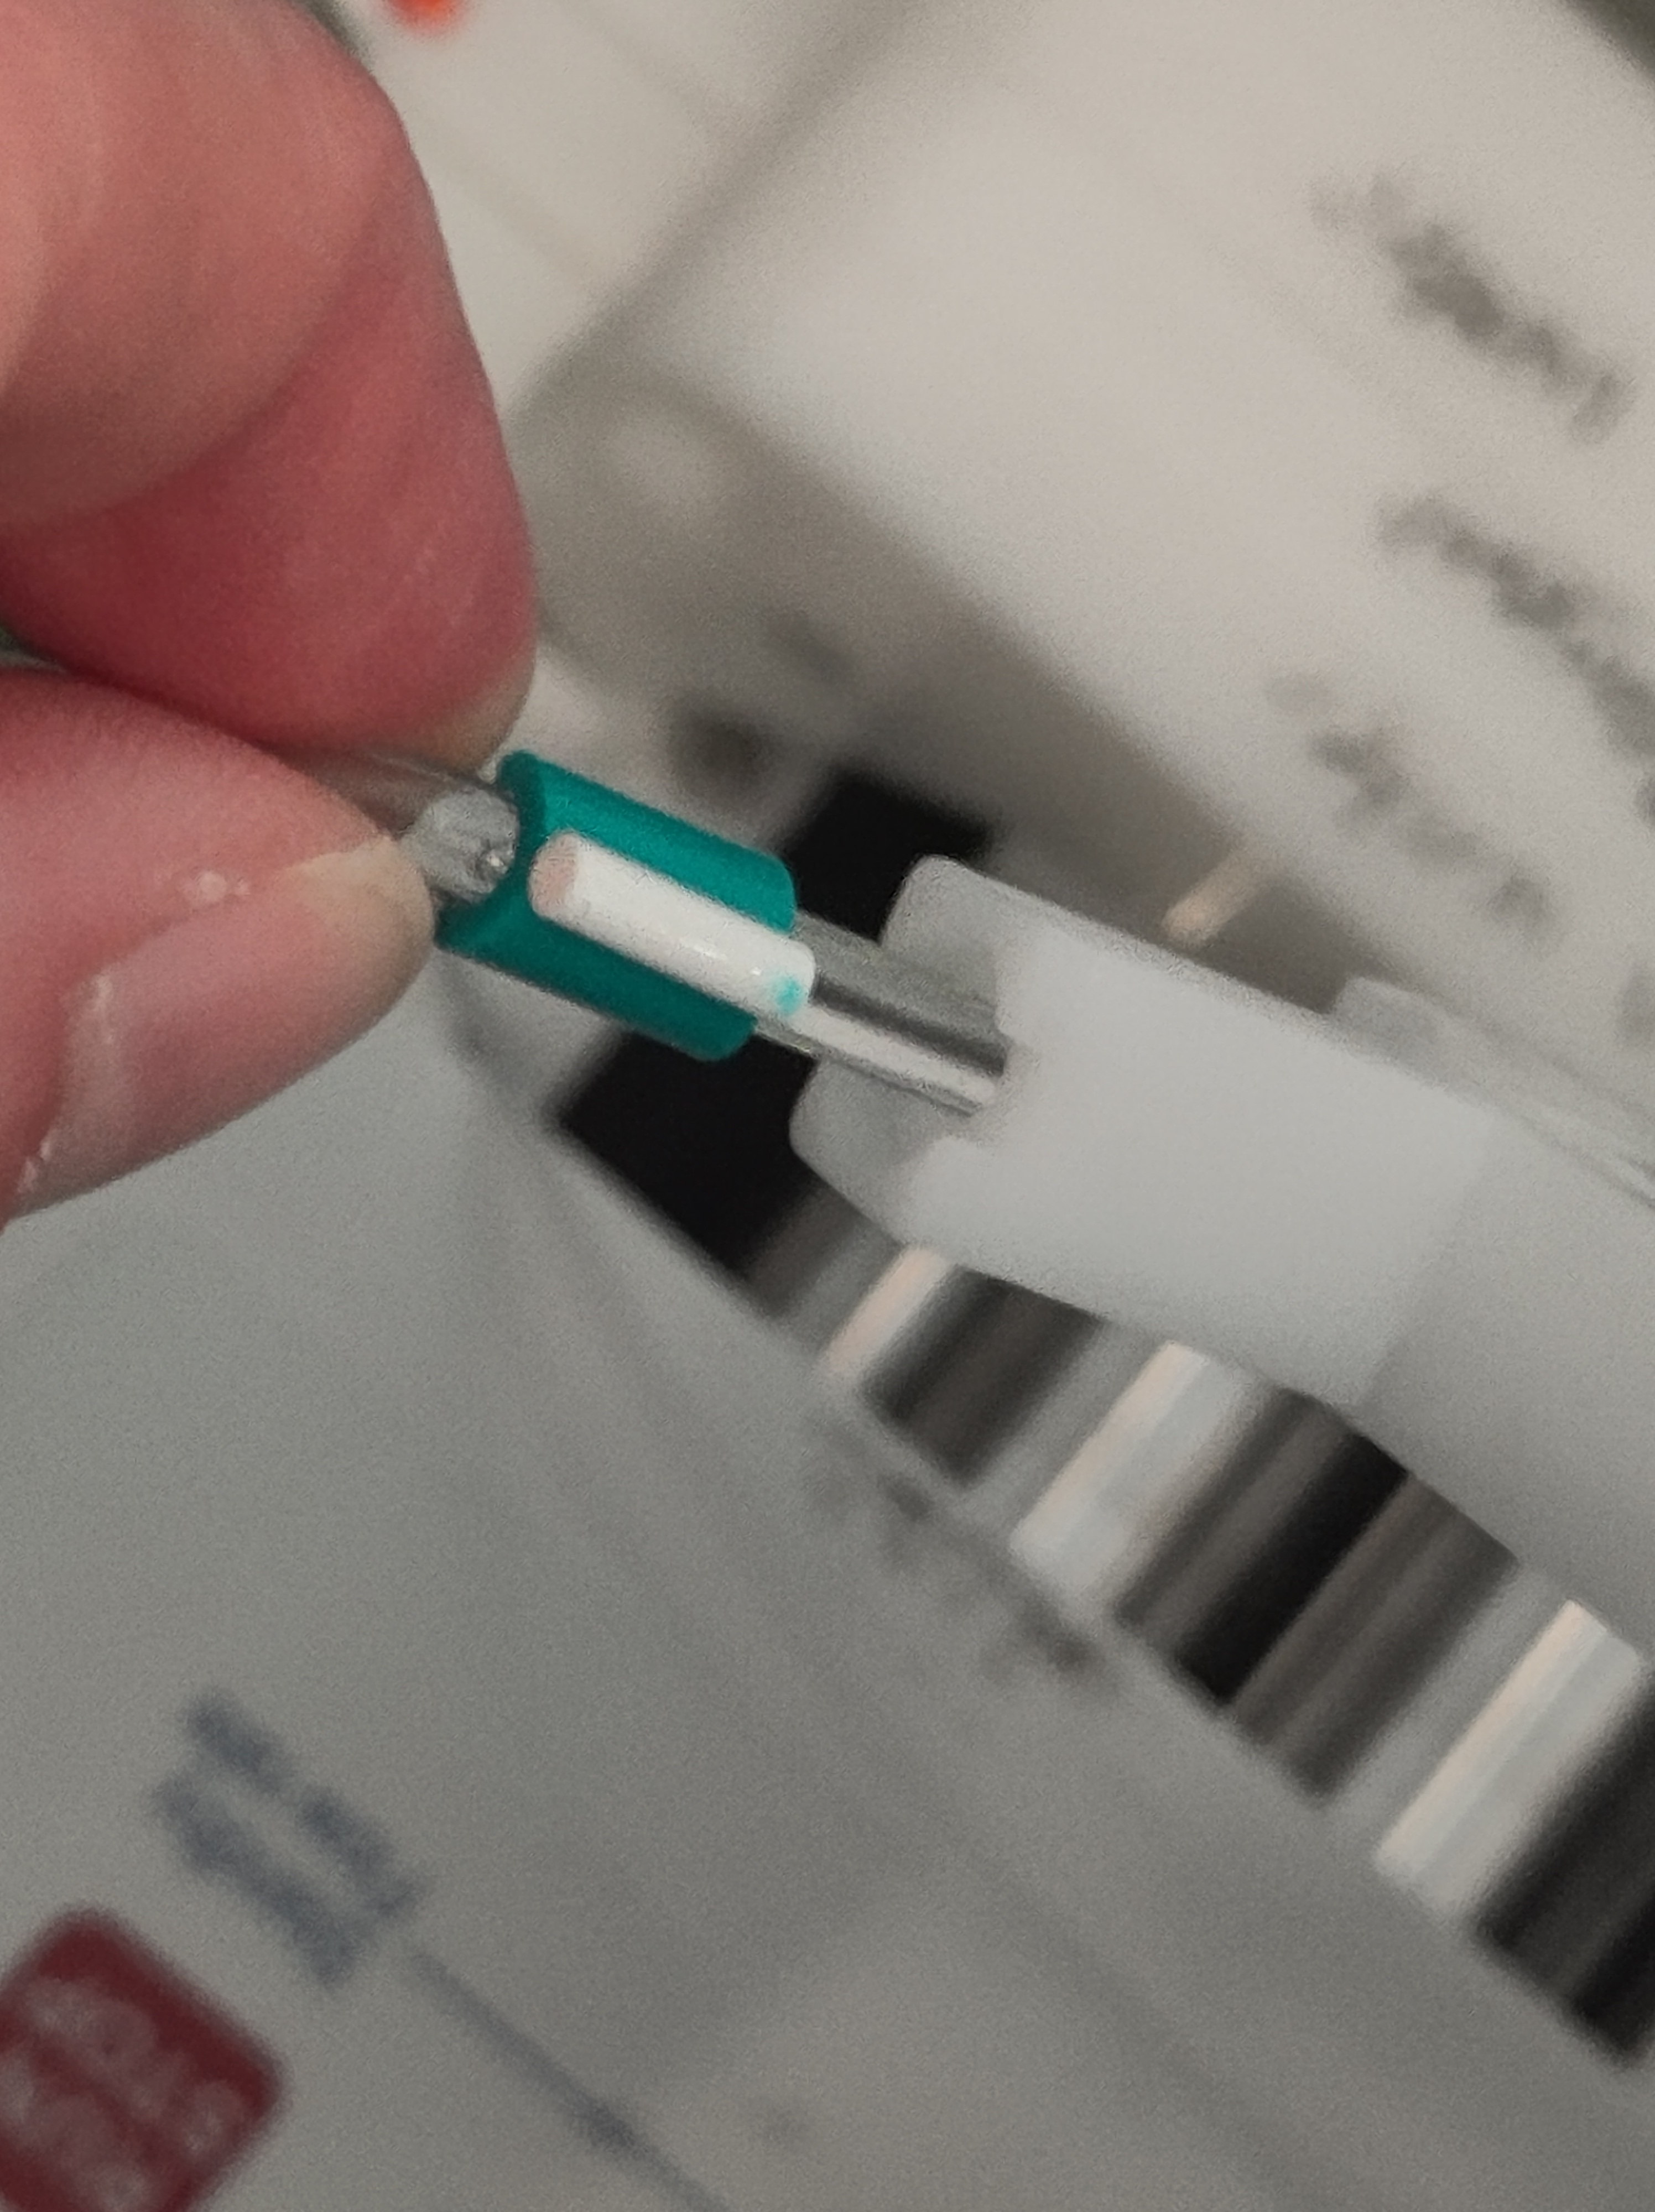
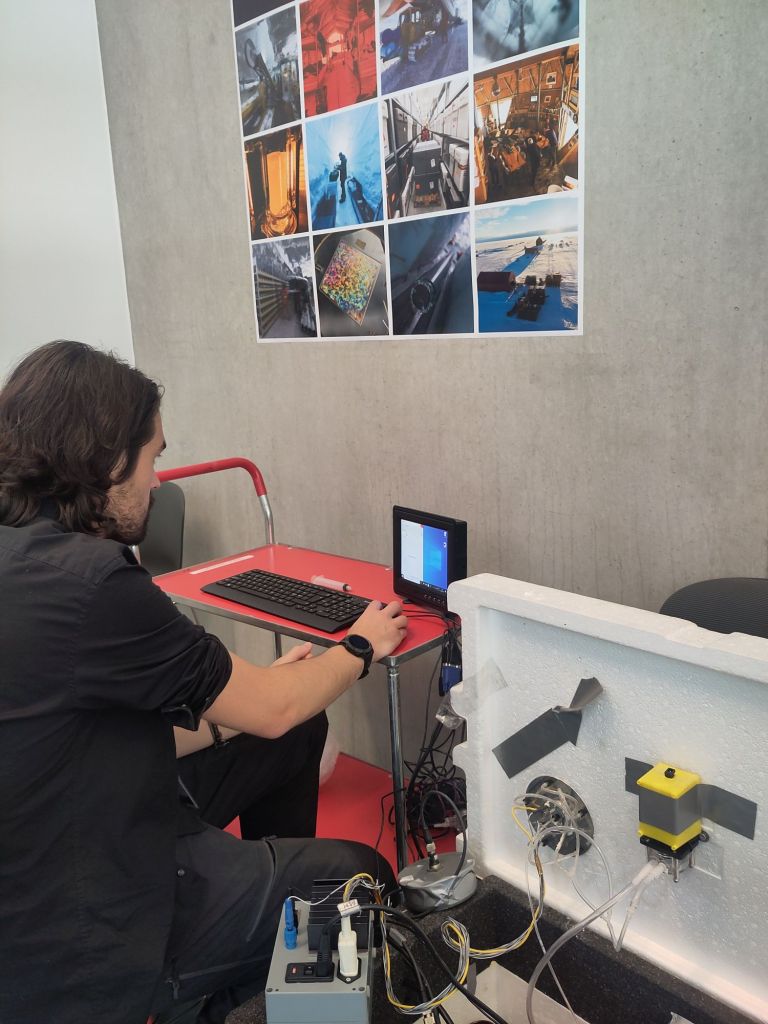
The box itself is conceptually simple but in practice a little complex with a multiplicity of tubes, connectors and spare parts. This means it’s easy to fix if it breaks down, but also we need to understand how it works first.
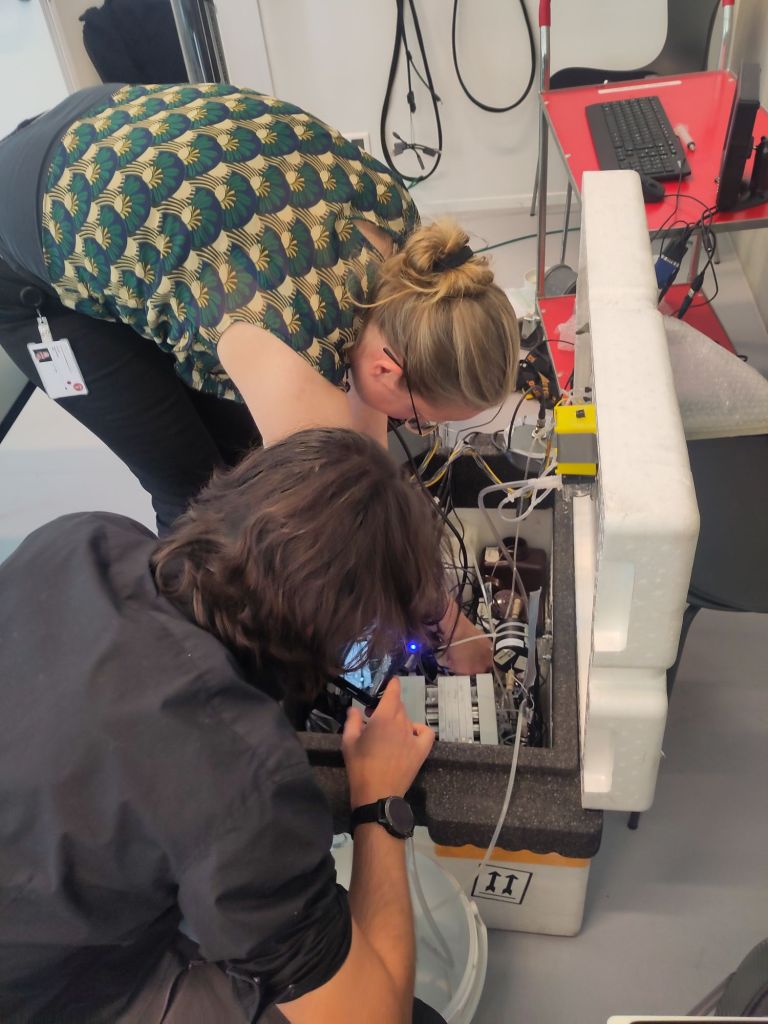
Today, the awesome and exceptionally generous Associate Professor Helle Kjær took myself, Stockholm Uni Prof Ninis Rosqvist and our PhD colleague from the Novo Nordisk funded PRECISE project, Clément Cherblanc through the use of the box.
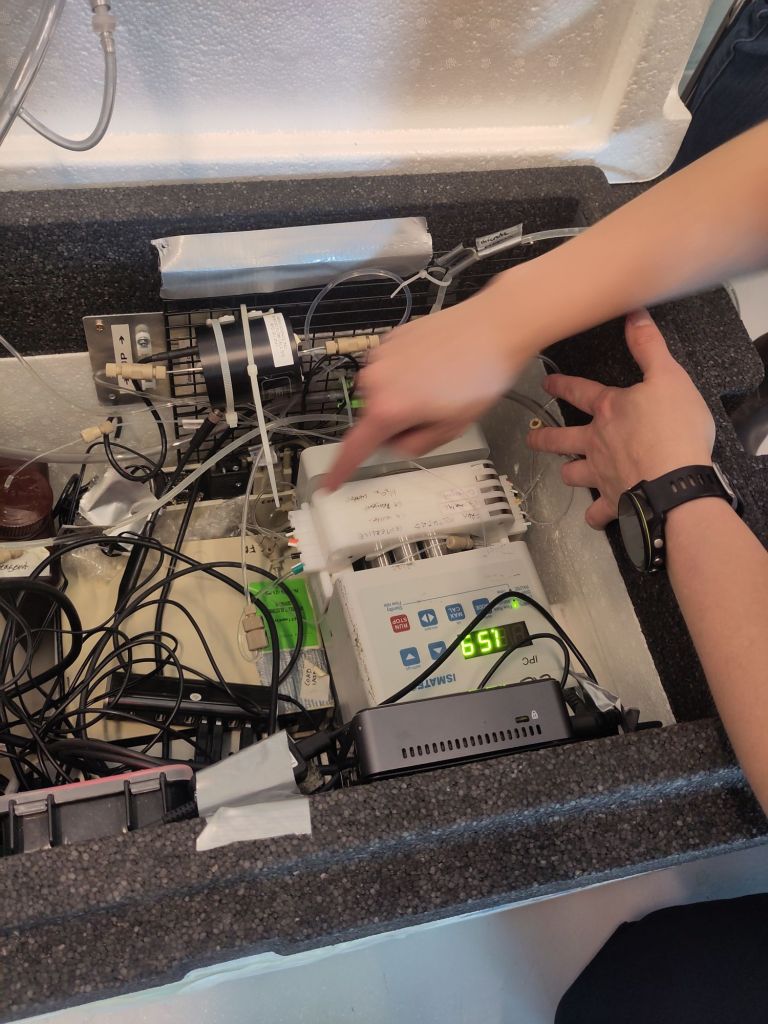
There’s a lot to remember and a lot to check but we’re reasonably hopeful we’ll get good results. The aim is to understand both the interannual variability on decadal timescales and the spatial gradients in snowfall accumulation. It’s a huge task, so it’s probably fortunate that we have 6 weeks or so (depending on the weather always!) to try and get it deployed at anumber of different sites which will hopefully allow us to do this.
It’s a big change to my normal fieldwork activities, but also a logical extension of them. And highly complementary to the climate and SMB modelling we are developing.
Nonetheless, ithere’s a lot of new stuff and I have in the past weeks learnt a great deal about transporting very small amounts of mildly hazardous chemicals on airlines, how to deal with customs and pack fragile instruments in large boxes.
Much more to come on this project, so stay tuned…
#PolarSekretariatet #AntarcticFieldwork #IceClimate #PolarClimate #Snow #SMB #AtmosphericVariability #iceCores #FirnCores #SnowCores


