A new paper came out today, and in some ways it is the end of an era. But the results are also quite important both scientifically and for society.
Benjamin Heurgue and Charles Amory, both at the Institut des Géosciences de l’Environnement in Grenoble, have done a magnificent job, leading a comparison of future Antarctic surface mass balance from three different regional climate models, including our own HIRHAM5.
Our DMI contribution was actually rather small: we basically contributed simulations and a bit of analysis, while all the hard thinking was done in Grenoble (and of course by our good friends and colleagues in Brussels, Utrecht, Bergen, Liège and Oslo, I very much enjoy working in these international teams).
The concept of the paper is beautifully simple. Take one global climate model (CESM2) running one high-emissions scenario, and downscale it with three regional climate models — MAR, RACMO and HIRHAM5.
Regional climate models are like a magnifying glass over the ice sheet: they get the same large-scale weather from the global model, but each has its own way of handling what happens at the surface — snowfall, melt, refreezing and runoff. The question Benjamin asked is: if we all start from the same place, do we end up in the same place?
For the present day: yes, reassuringly. All three models agree on today’s Antarctic surface mass balance — roughly how much snow falls, how much melts, and how much of that meltwater actually escapes. But by 2100 they diverge strongly, especially over the ice shelves. HIRHAM projects a large decline, MAR a moderate one, and RACMO stays close to balance. This might sound familiar. A similar paper led by Quentin Glaude about Greenland had a similar conclusion and as in that paper, the culprit is runoff.
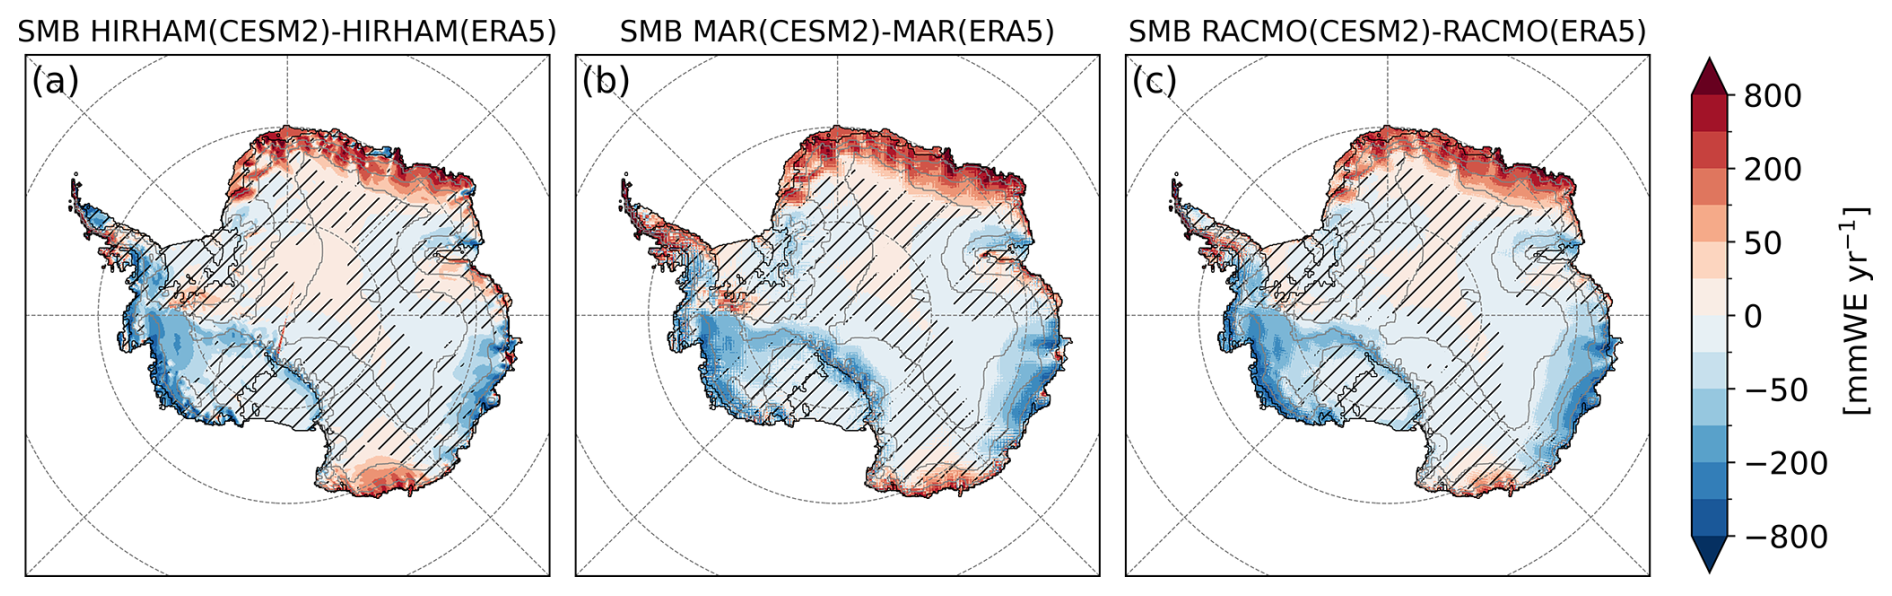
If the three models broadly agree (very broadly) on the SMB components at the present day, there are also some.commonalities in the future projections. Over the grounded ice sheet all of them project more snow as the world warms, because a warmer atmosphere carries more moisture, but it’s both the amount of melt and the amount of runoff that they disagree on.
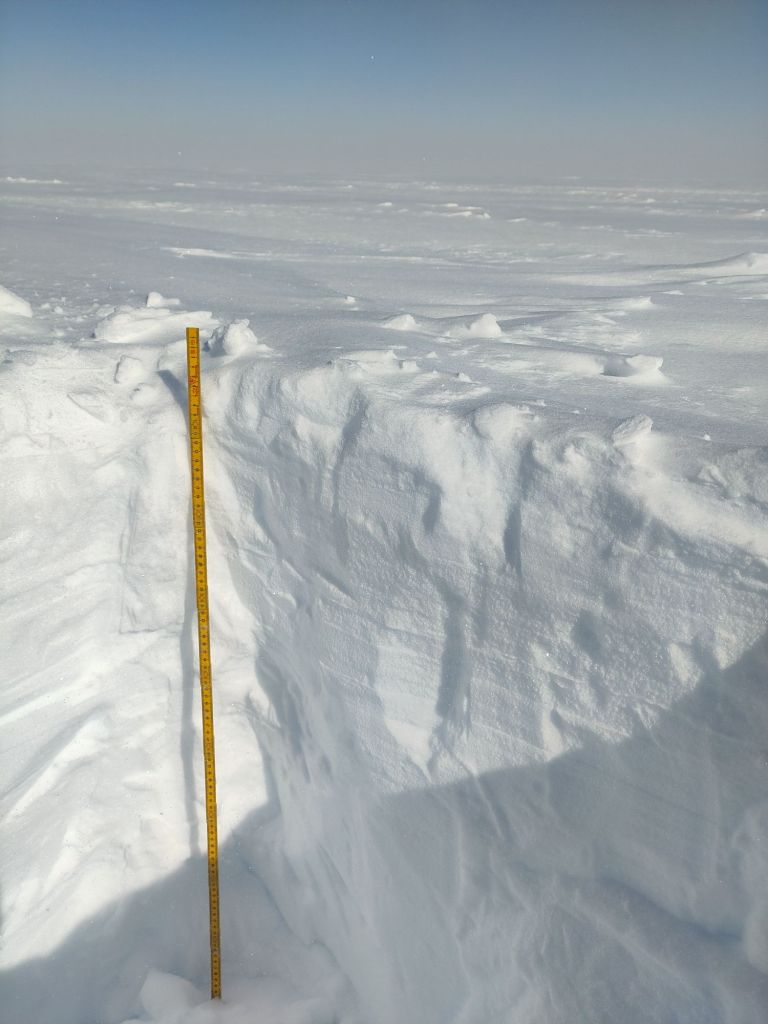
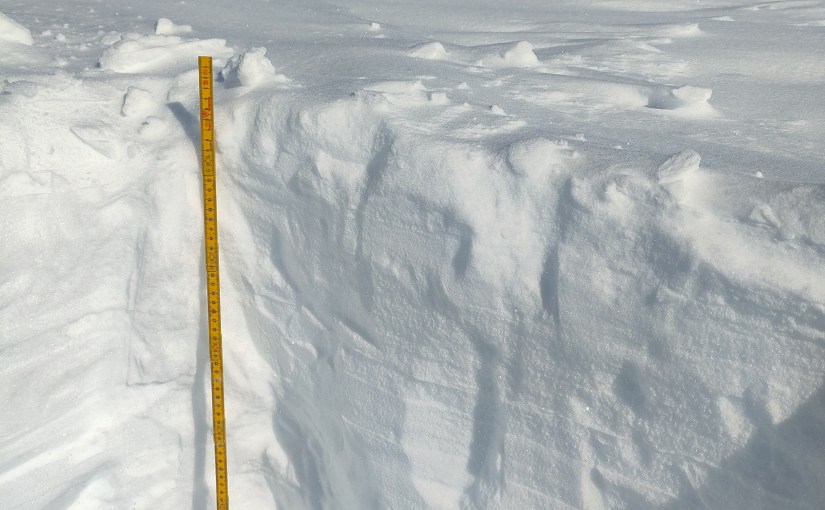
The divergence is mostly about the snowpack or rather what we call the firn (the top several metres of old snow, all of which has survived at least one full year at the surface but has not yet been compressed to glacier ice hardness). The snow and firn is like a sponge: if melt arrives slowly, the sponge soaks it up and refreezes it, and nothing is lost. If melt arrives faster than the sponge can absorb, or in the case of a glacier, faster than snowfall accumulates, the water runs off, and the budget starts to turn negative.
There’s an important feedback here too: melting darkens the surface, a darker surface absorbs more sunlight, and that helps even more melting. This is the albedo feedback and it’s a really important element in understanding how ice sheets will change in a warming climate. Each model has its own representation of the firn, and the melt albedo feedback and those details, multiplied over a century, produce completely different futures for the ice shelves.
The awkward bit is that our model is the pessimist of the bunch. HIRHAM simulates melt and refreezing rates today that are several times higher than MAR and RACMO, and it overestimates the number of melt days when compared with satellites. So when HIRHAM tells you the ice shelves are in trouble by 2100, it’s worth remembering that it’s the drama queen of the ensemble (there is nothing quite like co-authoring a paper that gently suggests your own model is the least well-behaved one). We’re pretty sure we know why: this version of the model has an albedo tuned for Greenland – too low for Antarctica and perhaps also some issues in the clouds.
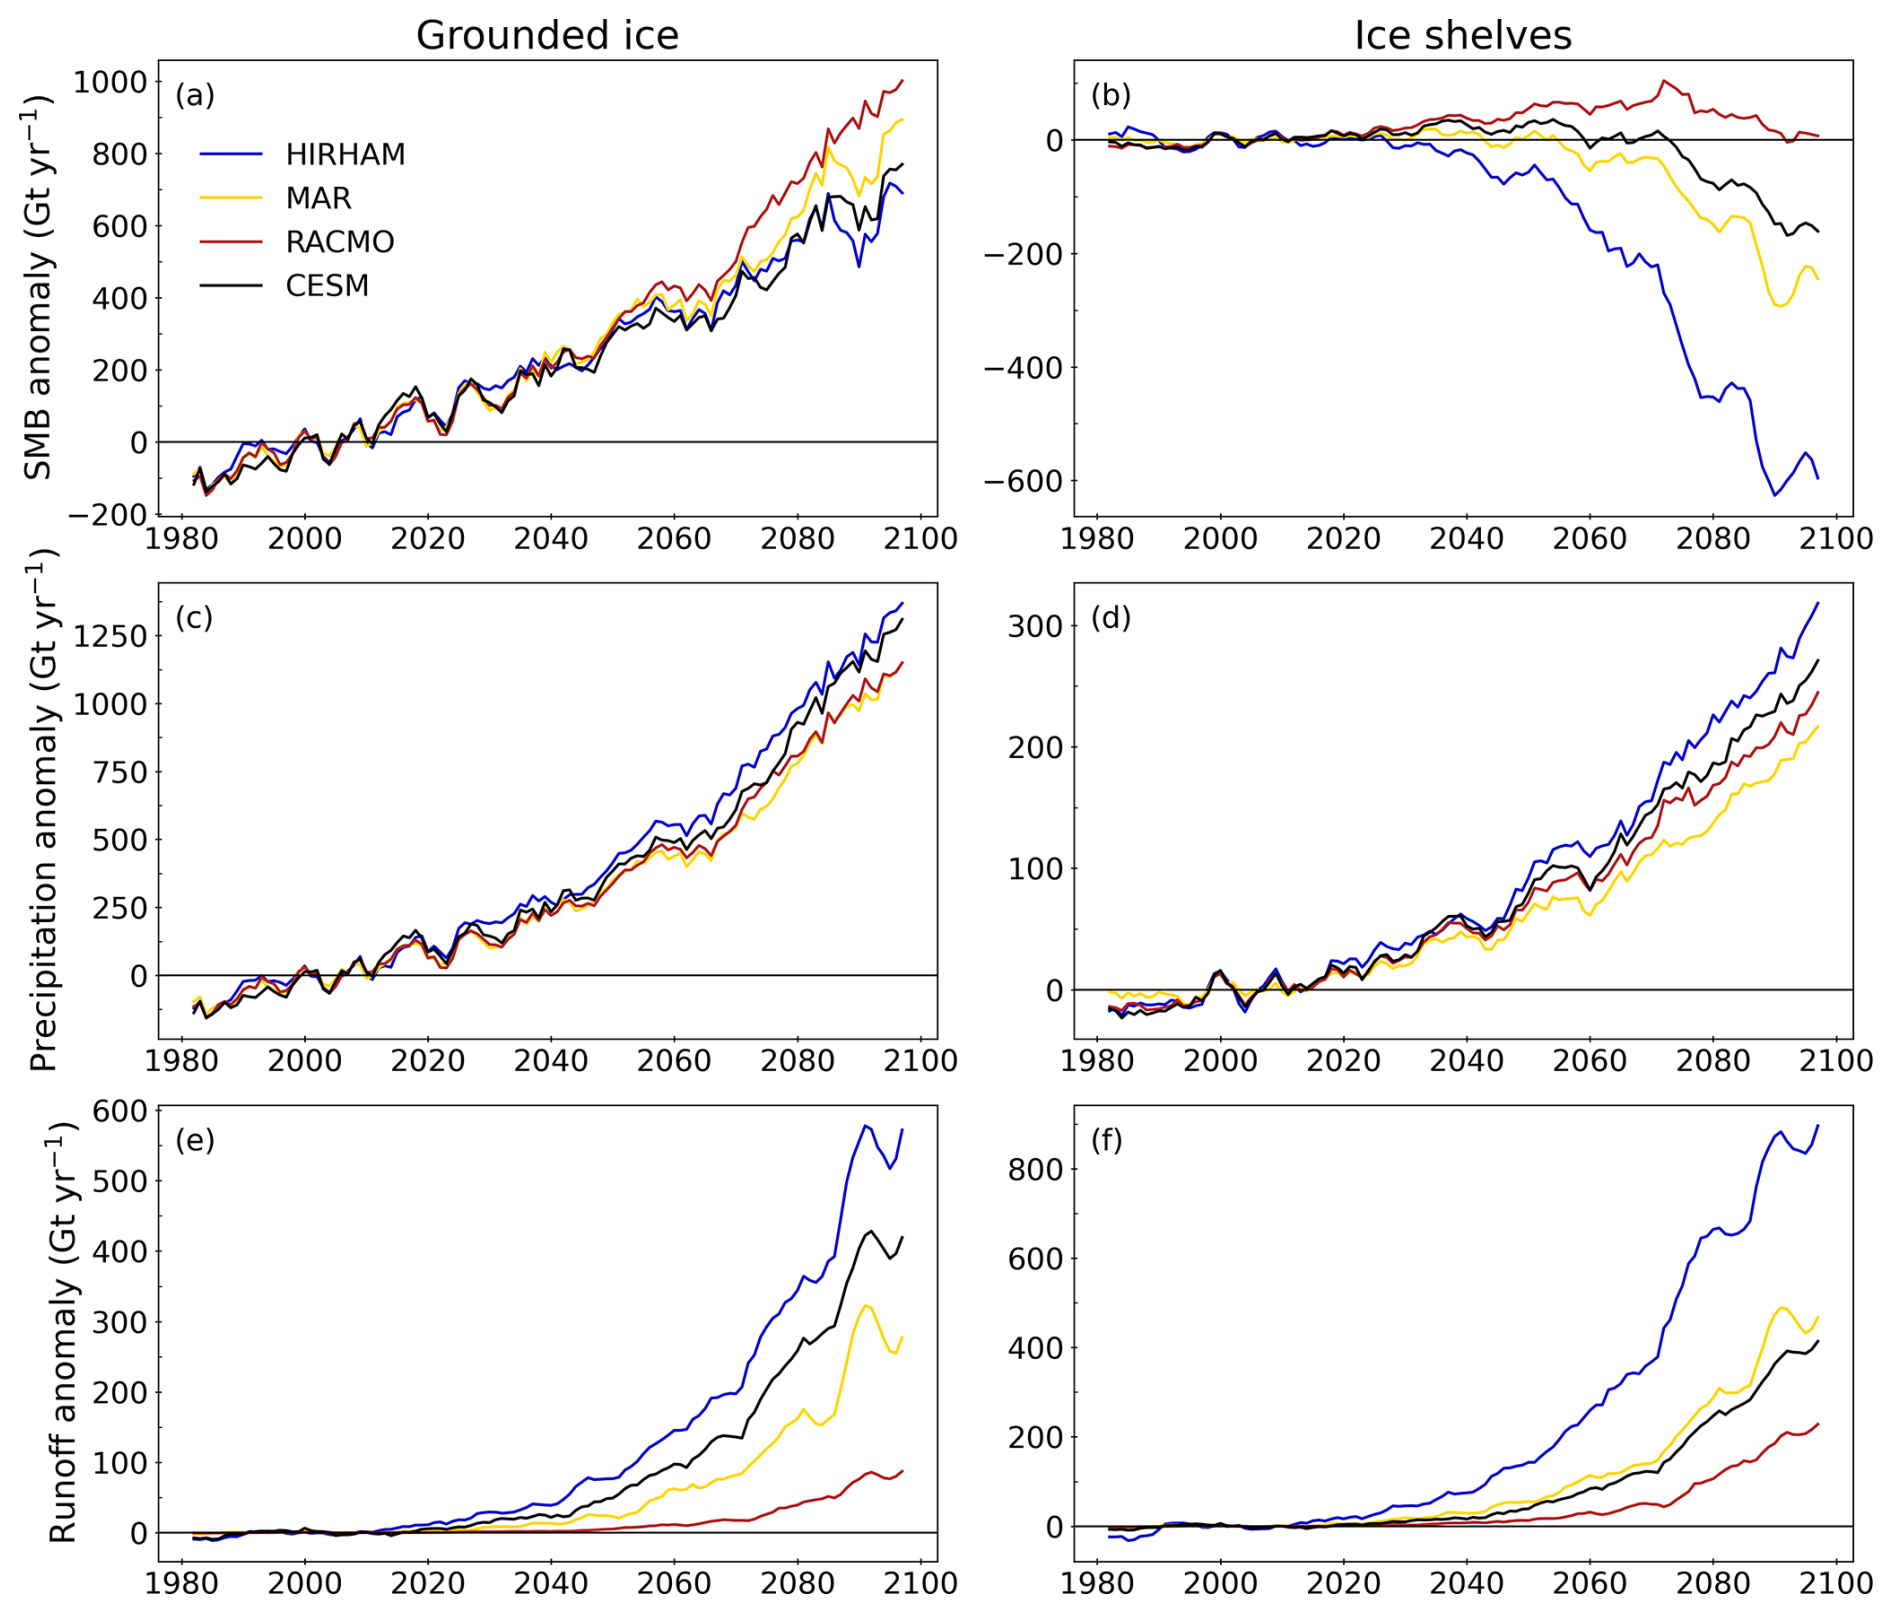
Interestingly though, even the two models that agree better with SMB at the start of the simulations, also diverge, as we also found in Greenland. The forcing model CESM2 also acquits itself respectably, though we have another couple of papers in the pipeline that muddy that picture a bit too..
The paper’s real point is that models agreeing on today’s climate does not guarantee they agree on the future — which matters a lot if you’re planning coastal defences, and argues for some hefty improvements in our understanding of the processes that happen at the interface of ice sheet and atmosphere. More on that soon too.
This paper originated with PROTECT, the EU Horizon 2020 project on projecting the ice sheet contribution to sea level rise, which for us at DMI wrapped up last year. Along with the multimodel projection datasets we produced for it, this feels like a good full stop on that project scientifically, though the projections will be included in planning for many years to come.
But there is another reason this feels like an ending: HIRHAM5, DMI’s polar regional climate model, has been retired for a few years now, and we’ve moved on to HCLIM, the climate version of the HARMONIE-ALADIN weather forecasting model.
This is, therefore very nearly the last HIRHAM paper. It will live on a little longer as the training data used in the development of our machine-learning model emulators, though there too we will soon switch to HCLIM (more on that another time), but as a model, HIRHAM is now in effect done.
“Finally, we would like to note that after 30 years of service the HIRHAM5 model was retired shortly after these simulations were complete, to be replaced by the HARMONIE-Climate system model (e.g. Verro et al., 2025). These will therefore be the last results published from HIRHAM, but the analysis here shows how important continuous assessment, improvement, development and evaluation of regional climate models is.”
Goodnight, sweet model.
As always, comments are welcome here, or find me on mastodon (@Ruth_Mottram).
Heurgue, B., Amory, C., Kittel, C., Boberg, F., Durand, G., Favier, V., Fettweis, X., Glaude, Q., Goelzer, H., Hansen, N., Jourdain, N. C., Mottram, R., Olesen, M., Van de Berg, W. J., Van den Broeke, M. R., and Wijngaard, R. R.: