Every September, as the melt season on the Greenland ice sheet fizzles out, I and my colleague Martin Stendel do the same thing: we sit down with a year’s worth of daily surface mass balance maps and weather charts from the Polar Portal, work out how the ice sheet fared, and write it up as a guest post for Carbon Brief. Our latest one, covering September 2025 to August 2026 has just appeared over there (yes it’s a little late, we have a lot on right now).
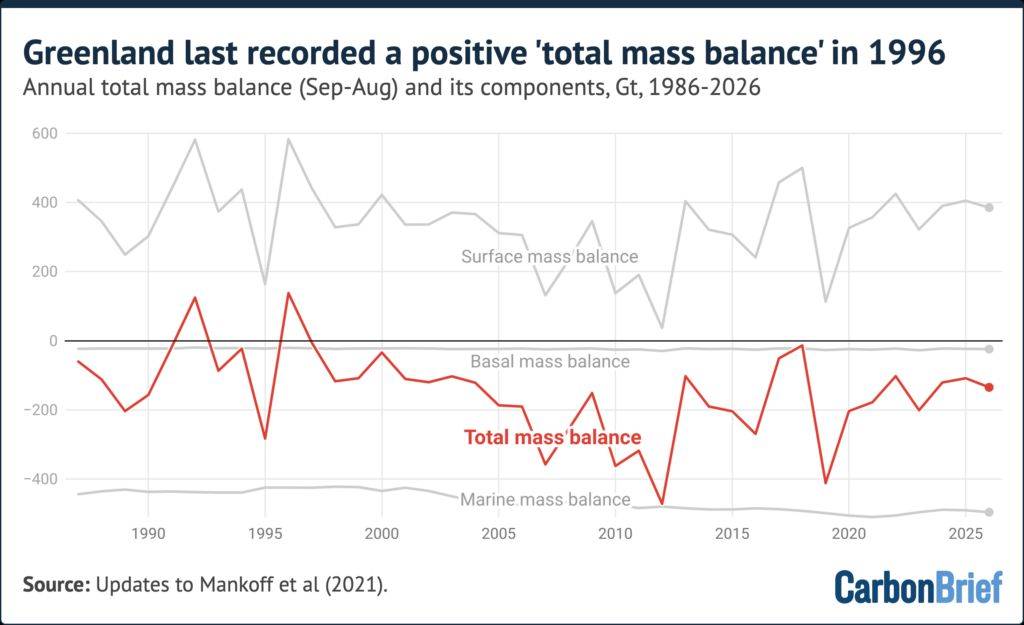
This year’s headline is one I’d rather not be celebrating: 2025-26 was the 30th consecutive year that Greenland lost more ice than it gained. The last year the ice sheet ended in the black was 1996. Even in a year with a cool, cloudy June, a late start to the melt season, and an above-average snowfall budget, it still lost around 135bn tonnes of ice.
It struck me, reading back through copy number eleven, that we’ve now been doing this annual health check for over a decade, (we have been doing the famous Carbon Brief pub quiz for almost as long). And I think it’s time to look back and draw a few longer term lessons beyond the single year reports.
Why do we write them at all?
The honest answer is that a single year tells you almost nothing. In 2017 we reported a year where Greenland probably almost gained a small amount of ice — a one-year blip, thanks mostly to heavy snow delivered by the remnants of Hurricane Nicole from the Gulf of Mexico (weather is a long distance phenomenon, and Greenland gets its winter snow from some surprising places). In 2019 the ice sheet lost 329 Gigatonnes after a dry winter and a hot summer. In 2022 and 2024 it lost barely 80 Gigatonnes each. The weather in any given year can swing the budget by hundreds of Gigatonnes.
So while the annual posts are really about that specific year, they’re also a ritual: an agreed moment to check the patient’s pulse and write it down, in the same way, every year, so the numbers can be compared over the longer term. The point of the series is the series.
The baseline has shifted:
In 2021 I noted something that has stuck with me: that year’s surface mass balance, about 396 Gigatonnes, was thoroughly average for the current climate — but in the late 1990s the same number would have been one of the very lowest years on record. What counts as “normal” for Greenland now would have been an alarming outlier when I started. Shifting baseline as the biologists call it is real, but also for the physical climate system: we keep having to re-define “normal”, and in the case of mass budget it seems it is mostly downwards, but we also have to look back and remind ourselves regularly what normal was, back in the day.
When I was a child growing up in England, butterflies were common in our garden, our cars were often covered in dead insects, a hot summer day was 25C (very rarely 30C) and vast rivers of ice came plunging off alpine mountains. None of those things are true anymore.
The Greenland ice sheet is still a vast amount of frozen water, and it will take a very long time indeed for that to change, but the point of our annual health check is to detect, are there important changes in the stability of the patient?
Now for the obligatory small print warning: A healthy surface is not necessarily a healthy ice sheet. Every year, the surface mass balance defined as the snowfall in and the meltwater runoff (that is surface melt but minus any refrozen or retained in the surface snowpack) out, just like in a bank account has been positive. Often comfortably above average. So far so good.
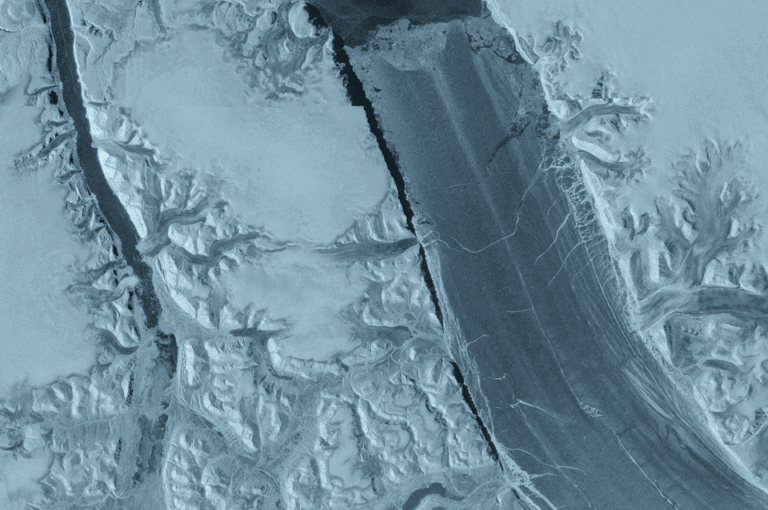
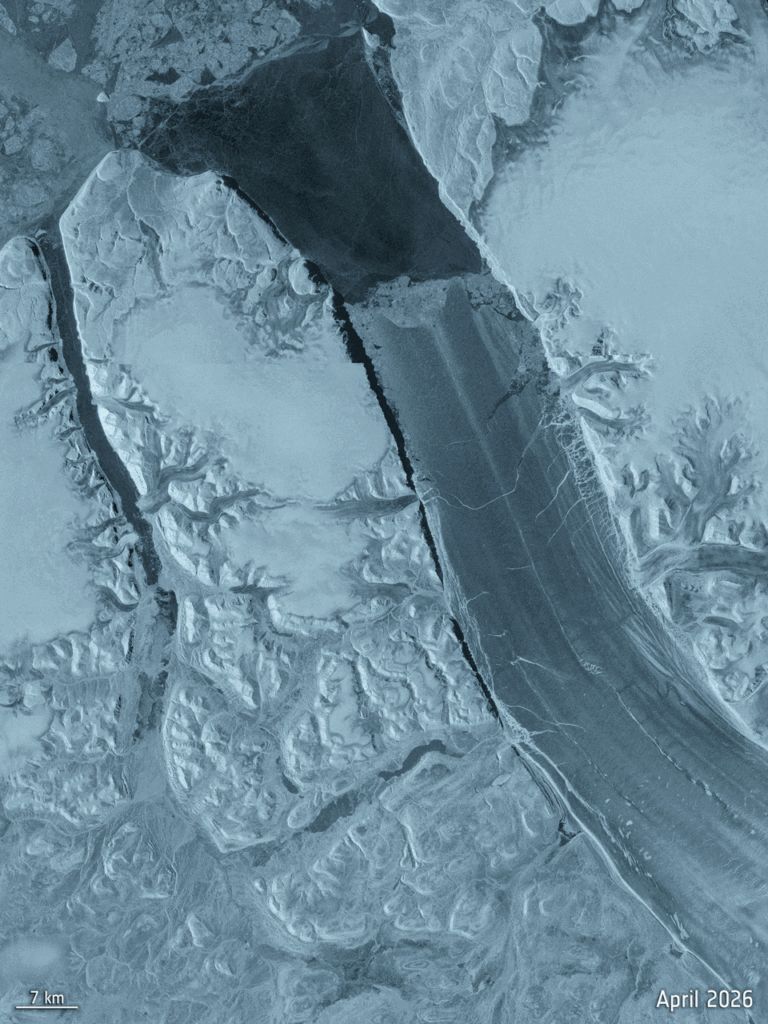
But then every year for thirty years, the ice sheet has still shrunk, because the losses at the edges (icebergs calving, warm seawater melting glacier fronts) have quietly exceeded the surplus. I have lost count of the years where the headline was “good snow year, we still lost ice” including this year, where for example the Petermann glacier calved off a 76 km² ice island in early August regardless of the mild summer.
The surface is my own specialty, and I’m very fond of it, but it isn’t where most of the loss is coming from yet.
Through all of the series though, we can discern some consistent patterns. A dry winter plus a hot summer is the disaster recipe: as it was in 2019. A cool, snowy June acts like a shiny protective blanket and can rescue a mediocre year: 2021, 2023 and again this year. And remarkably often, while Europe and North America swelter in heatwaves, Greenland sits on the cool, wet side of the same stuck jet stream pattern. In 2018, 2023 and again in 2026 the same blocked “Omega” weather that baked Europe left Greenland comparatively damp and comfortable. The same pattern shifted by just half a wavelength in the atmosphere either way, and we’d be reporting record melt in Greenland instead.
Even the “nothing happened” years have been hiding things. In 2016 the year looked textbook average, until an April heatwave produced the earliest melt event on record, followed three months later by a new *cold* record in July. Average years, it turns out, are rarely average; you just have to look closely enough. (That year also taught me something about my own work: when we upgraded the DMI model, “average 2016” turned out to have been a rather low, unusual year. The instruments improve too.)
Taking the long view..
Earlier this year also saw publication of a big review I’m a (very minor!) co-author on, led by Prof. Edward Hanna at University of Lincoln, which synthesises everything we know about Greenland surface melt from 1500 CE out to 2200 covering data from ice cores, the satellite era and projections. It makes the same point out eleven annual posts have been circling around, but with 500 years of evidence instead of a decade: the year-to-year wobbles sum up to a trend that only points one way, and melt is now visibly in the driver’s seat.
Thirty years is also a meaningful number for a different reason: it’s the length of a “climate normal” period the span climatologists use to separate a genuine shift in climate from natural variability. With 30 consecutive years of losses, warm years, cold years, snowy years, altogether we can now say confidently that what we’ve been writing in these annual posts isn’t weather any more. It’s climate change.
The long view: Hanna, E., Box, J.E., Fettweis, X., van den Broeke, M.R., Wake, L., Luu, L., Maddison, J., Mote, T., Mottram, R., Noël, B., Preece, J., Topál, D., Trusel, L. et al. Past, present and future Greenland Ice Sheet surface melt, 1500–2200 CE. Nature Reviews Earth & Environment, 7, 511–527 (2026) doi:10.1038/s43017-026-00800-3
The annual summaries are built on the daily monitoring at the Polar Portal supported by the Danish Meteorological Institute (through NCKF) and ESA’s Climate Change Initiative.
As always, questions and comments welcome below or on Mastodon

