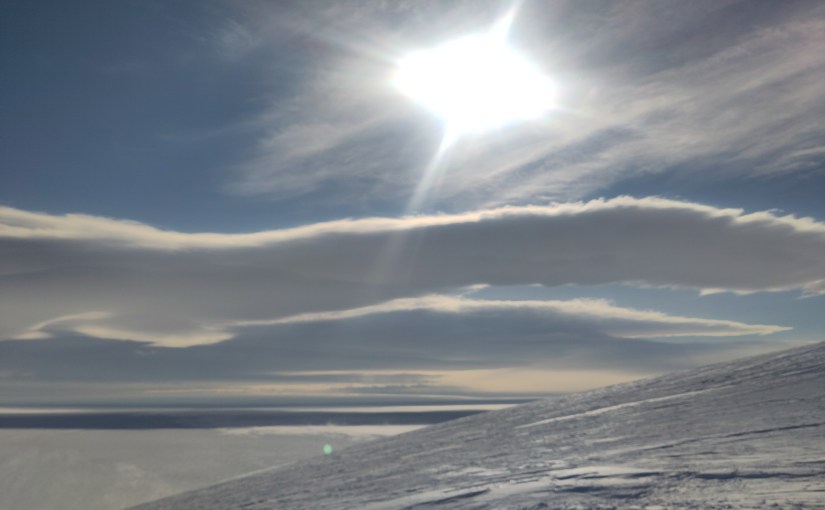
Here’s a sentence I have been promising to write on this blog since at least March this year: Antarctica has been gaining ice since 2020. Not losing, gaining. Only 68 gigatonnes a year admittedly, actually a mere drop in the ocean, (or should that be crystal in the ice sheet?), given the vast size of the place, but an (almost) new paper that I worked on, led by the excellent Marlen Kolbe, explains why.
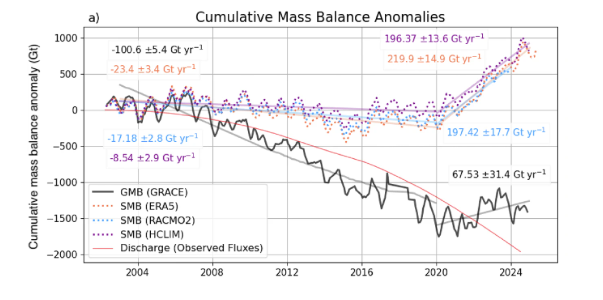
First, the background. For most of this century, the Antarctic Ice Sheet has been losing mass at a pretty steady rate of around 100 Gigatonnes a year, pushing up global sea levels a small amount (About one third of a millimetre per year in fact, a little less than half the Greenland contribution for example). Antarctica is by far the biggest potential contributor to future sea level rise, so this is the number we all watch rather closely, as we also discussed the other week when the IMBIE paper came out. Then, around 2016, the satellites started telling us something odd: the losses were slowing down. And by 2020, the whole continent had swung into a small but definitely positive net gain — even though the ice flowing out to sea from West Antarctica’s glaciers kept accelerating throughout (the red curve in the figure above and the red areas in the discharge maps below).
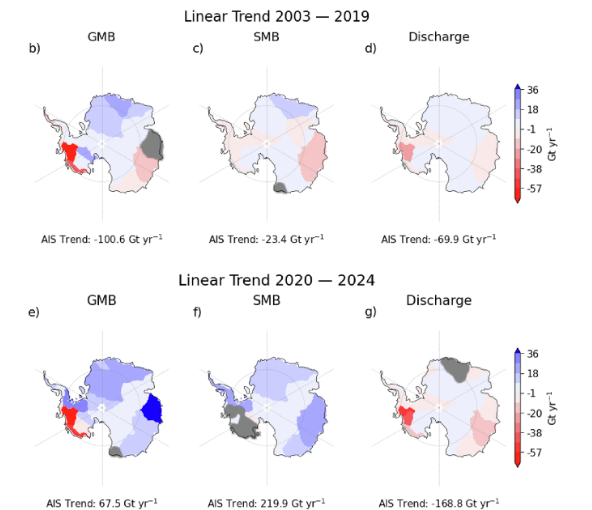
So what was going on? The answer, it turns out, is snow. Rather a lot of it in fact, falling mostly in East Antarctica, but also in other events over the peninsula and in West Antarctica. But what was driving those enhanced snowfalls? The blue bits in the picture above show regions where there is an increase in snowfall
In what is either an incredible coincidence, or somehow a related process, at the same time the sea ice around Antarctica started to decline, big time:
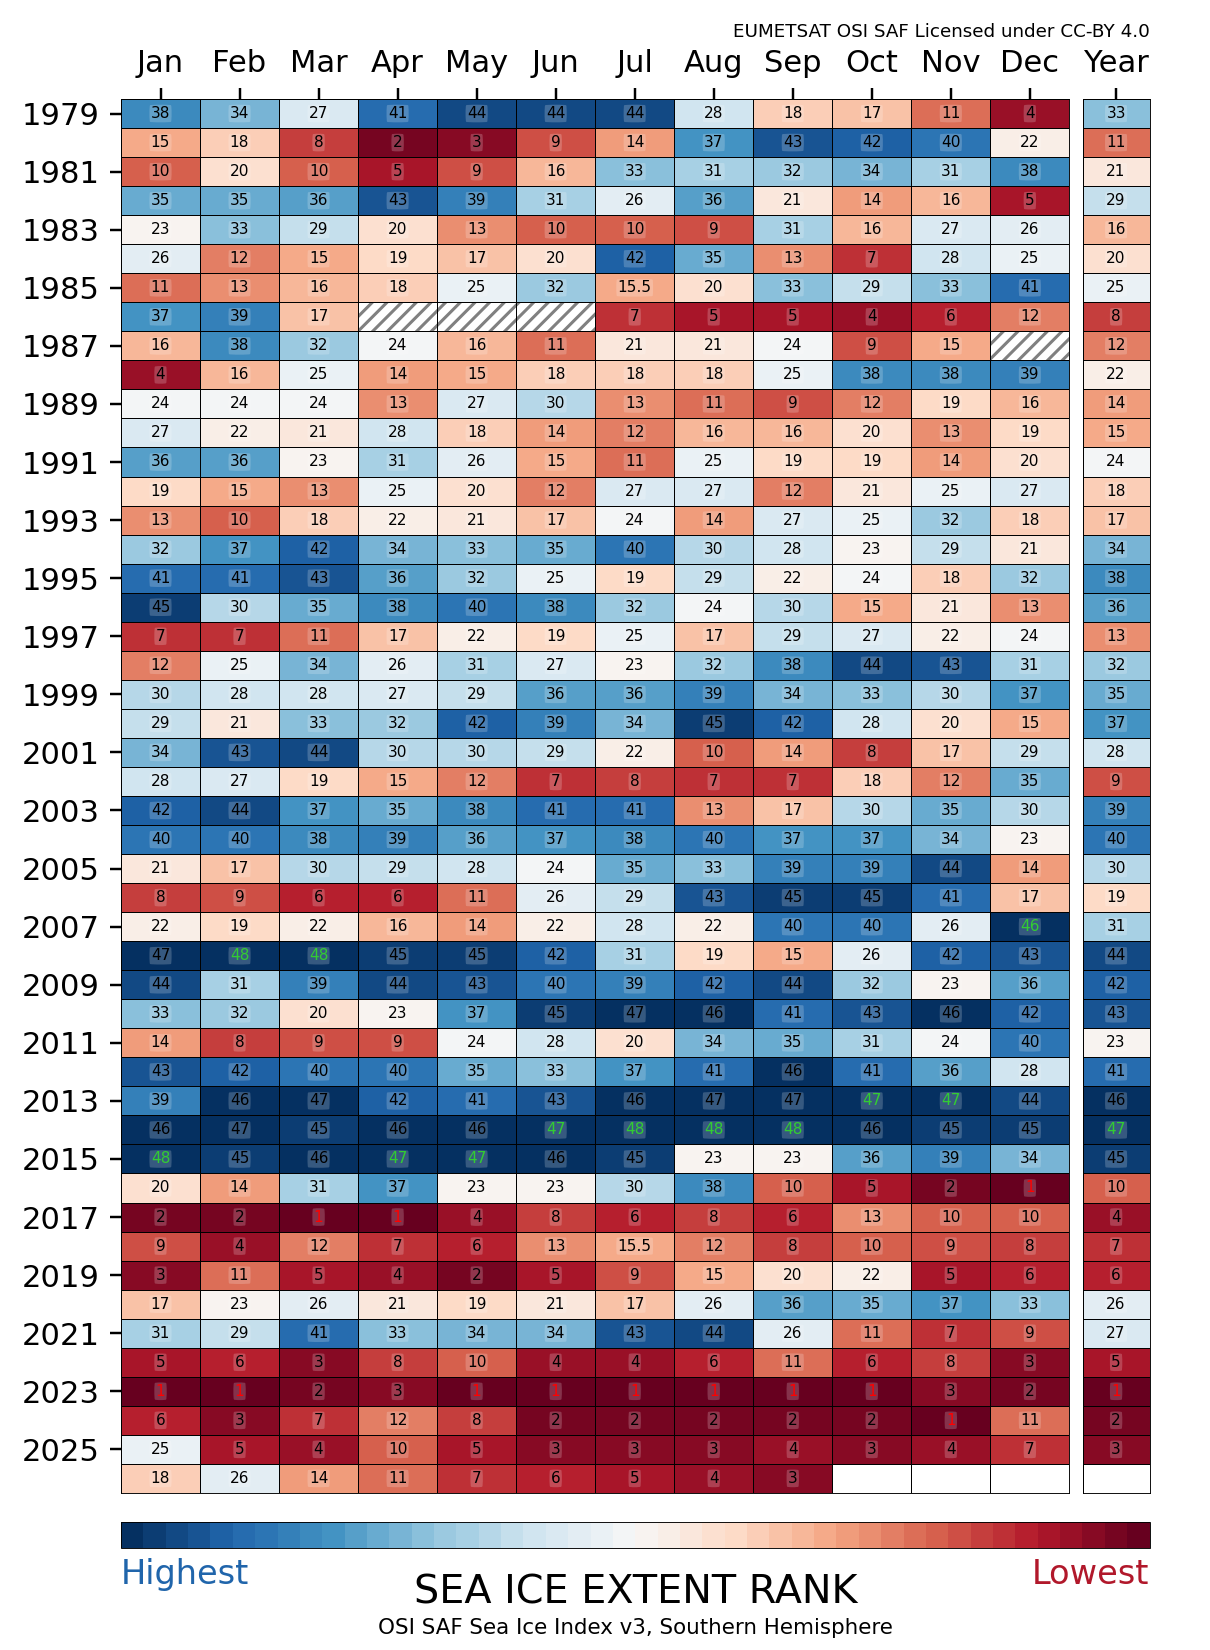
This was also an idea we explored in our Greenlandification paper, so my initial suspicion was that the loss of sea ice around the continent allowed more snow to reach the coast, both because more open water meant more evaporation from the sea, but also because less was lost over the sea ice. And a first sight of the statistics seems to support that.
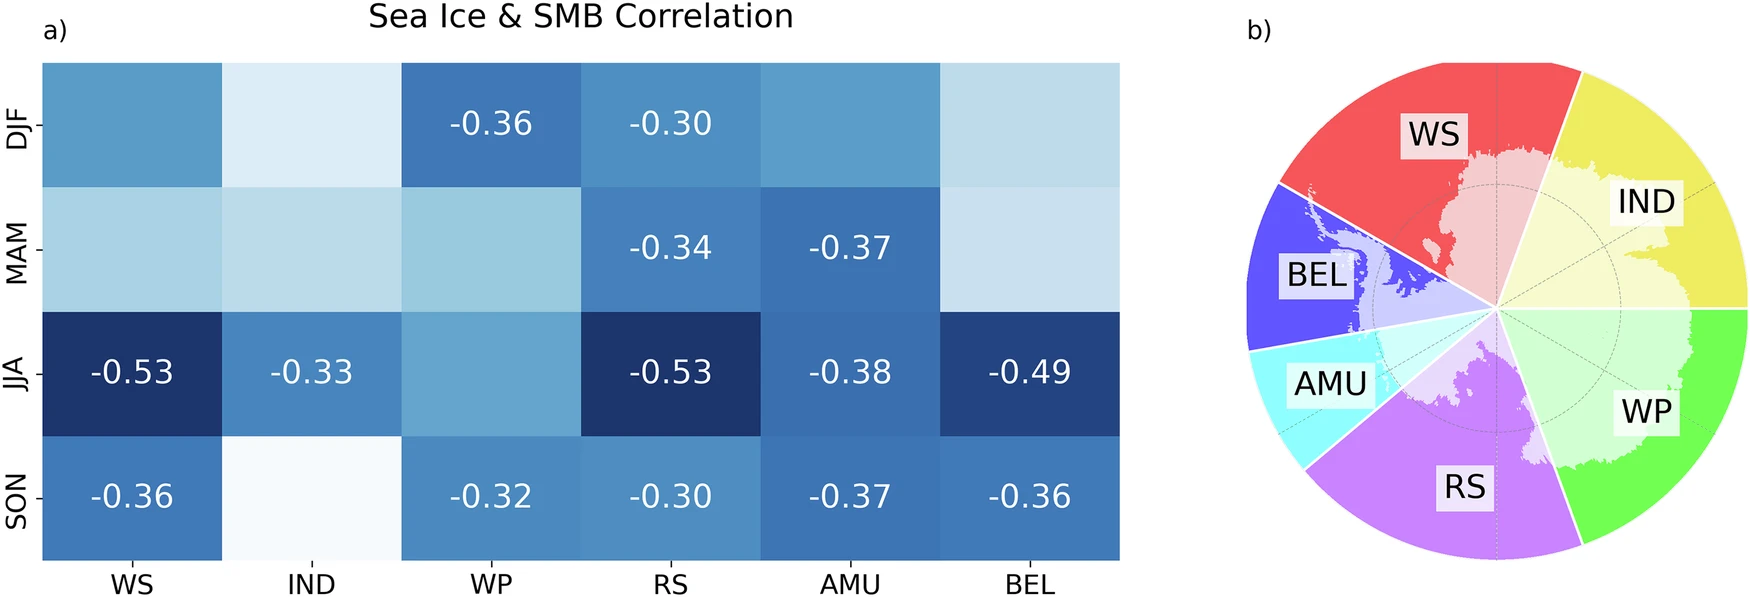
But it’s not very convincing – those correlation values are pretty low in most cases and of course, as we all know, correlation doesn’t really prove causality. So given we have a model, we could actually do something kind of cool, and run some experiments. In this case we added additional sea ice and we took sea ice away. And we showed that indeed there is a *small* effect of sea ice on the snow that reaches the continent.
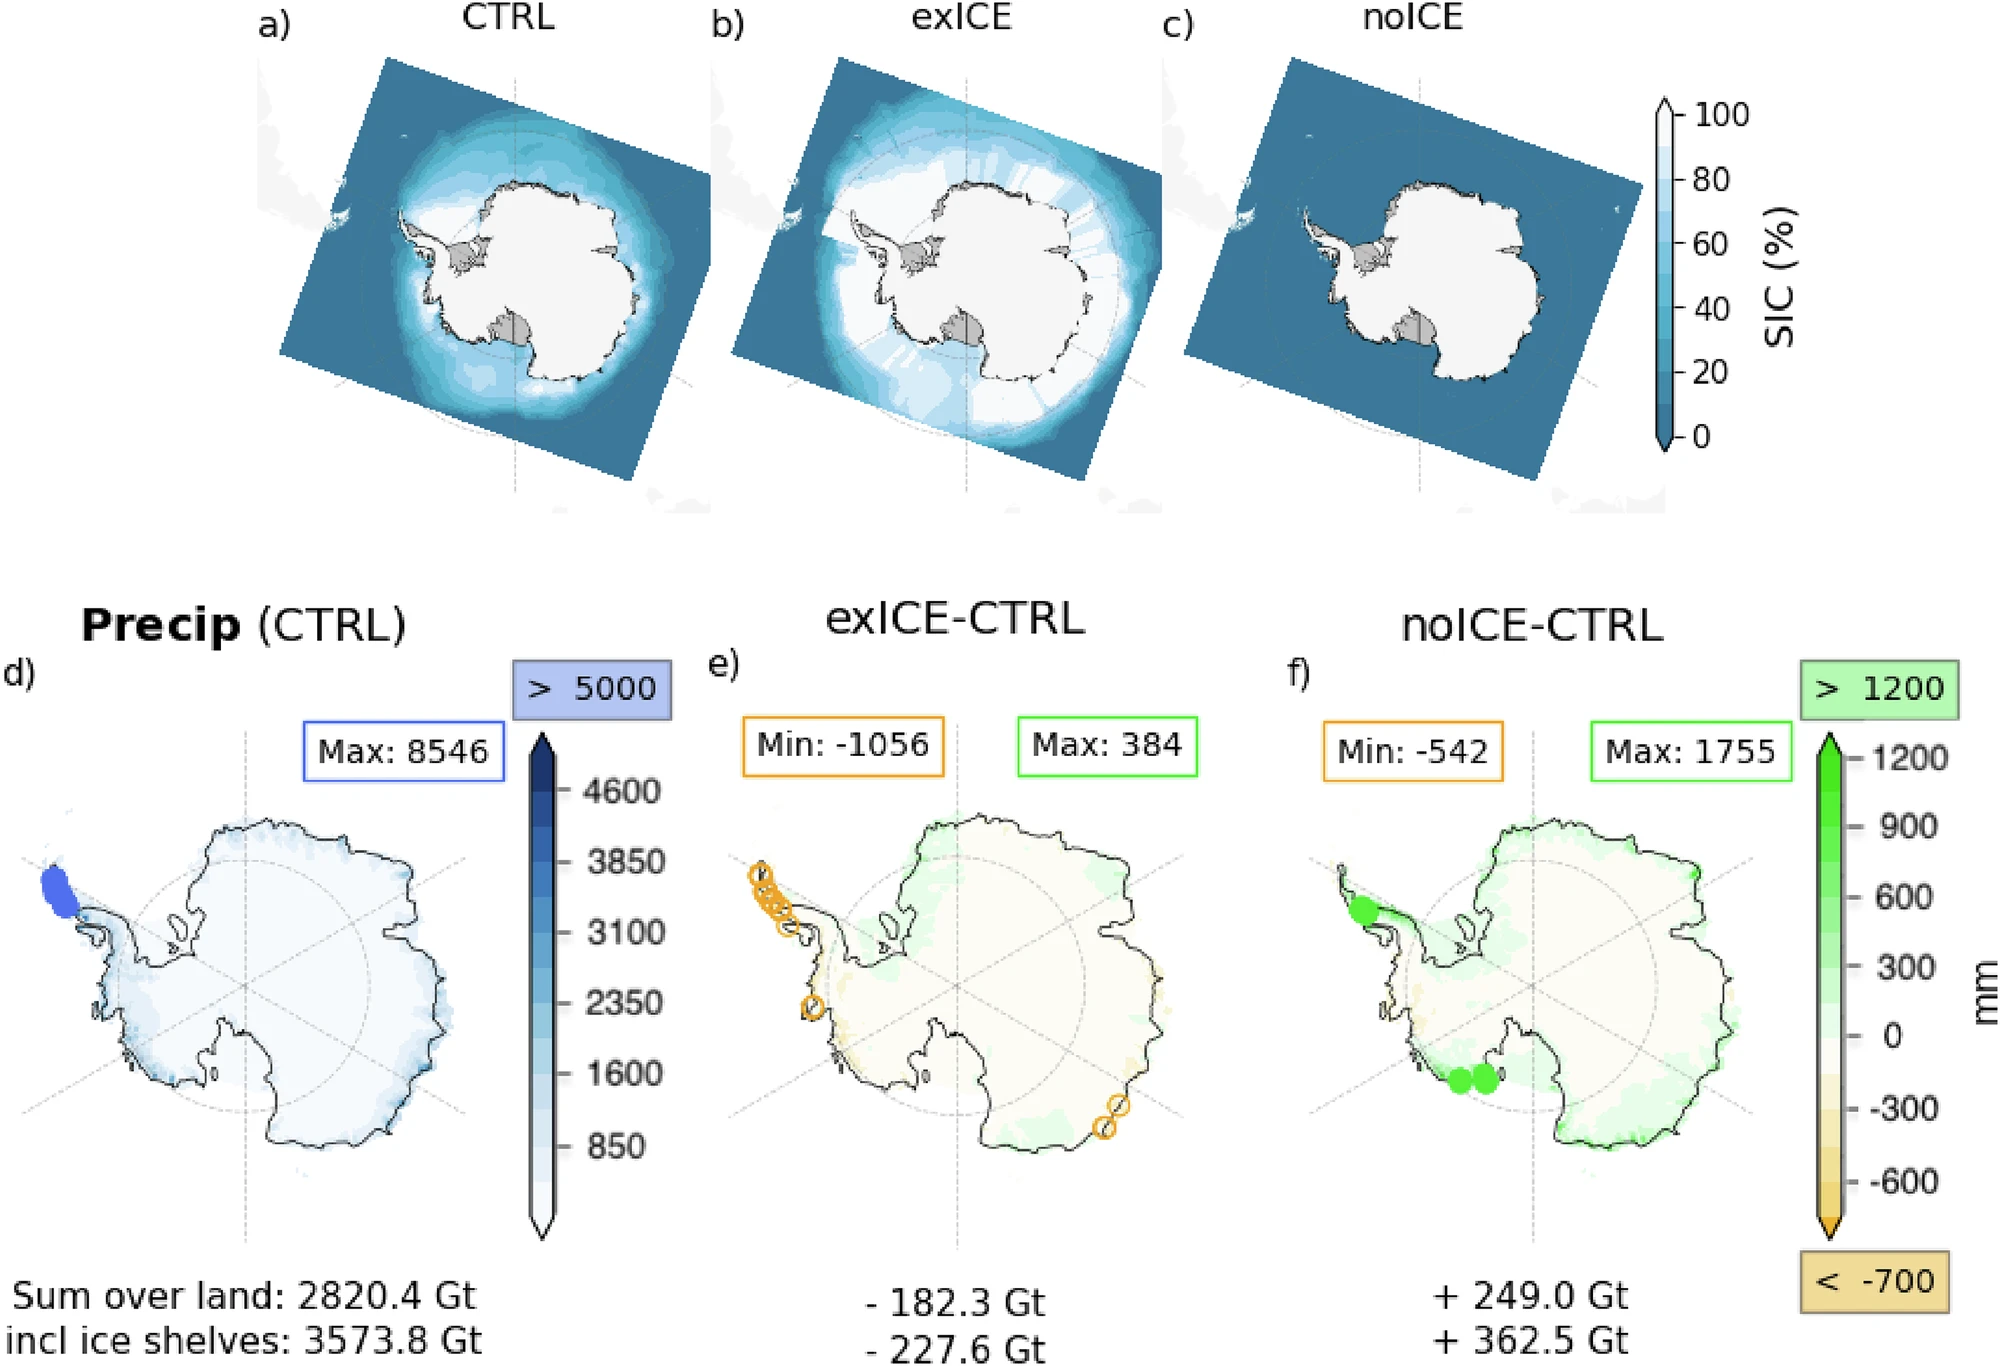
But there is also likely another explanation..
Rivers in the sky
The snow delivery service comes in the form of atmospheric rivers. As the name indicates these aren’t rivers of water on the ground but long, narrow filaments of water vapour in the atmosphere, and they can carry astonishing amounts of moisture from the subtropics all the way to the Antarctic coast. When one of these slams into the steep edge of the ice sheet, all that moisture falls out as snow.
Think of them as the sky’s equivalent of a shower: most days the atmosphere delivers very little moisture or a relatively small even flow for a quick wash, but occasionally the power shower comes on and a single event dumps a month or even a year’s worth of snow in a day or two.
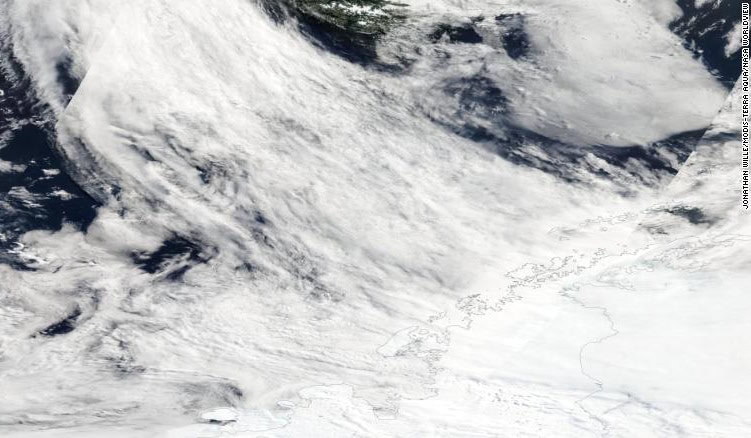
Marlen’s analysis showed that from 2020 onwards, atmospheric rivers reaching Antarctica became both more frequent and more intense, helped along by stronger westerly winds (an effect of the southern annular mode, known as SAM to friends) and changes in the sea ice around the coast. East Antarctica got hammered with exceptional snowfall in 2022 in particular especially in Queen Maud Land and Wilkes Land and that extra snowfall more than compensated for the (still increasing!) ice loss from West Antarctica.
This is the surface mass balance doing its thing: SMB is a two-way term, with snowfall adding mass and melt and runoff removing it. In Antarctica there is very little surface melt and even less runoff so a few enormous snowfall years can push the whole continent’s ledger into the black, even while the dynamic term, what we call ice discharge in the paper, which only ever removes mass, has been accelerating.
So is this good news?
I’m afraid not, or at least, not necessarily.
We don’t know yet whether this gain is a temporary blip or a lasting feature of a warmer world. Atmospheric rivers are driven by weather patterns reaching Antarctica from the tropics and mid-latitudes, and the patterns that control them can shift as another recent paper (that came out after ours) also pointed out. A few years with fewer atmospheric rivers could easily tip the mass budget back to losses, even larger ones than before given the acceleration of ice lost in West Antarctica.
The satellite debt
None of this would be known without the GRACE satellites (and the successor, GRACE-FO), which measure changes in Earth’s gravity field and can effectively weigh an ice sheet from orbit. It never ceases to amaze me that we can now effectively put the Antarctic Ice Sheet on a bathroom scale, as a friend of mine once commented – we’re really living in the future with this stuff. The work was part-funded through ESA’s Climate Change Initiative (of which more in a later post), which has quietly built some of the most valuable long-term climate datasets we have, this study is one more reason they deserve support. Modelling was conducted in the course of our Horizon Europe OCEAN ICE project that is now sadly coming to an end (more of that anon).
The paper
Full credit to the immensely productive Marlen Kolbe, who led the work based on ideas we had while she was a visiting PhD student, and to my ace colleague Abraham Torres Alavez who ran the multiple experiments as well as to all my co-authors.
Kolbe, M., Torres Alavez, J.A., Mottram, R., et al. (2026). Atmospheric rivers and winter sea ice drive recent reversal in Antarctic ice mass loss. Communications Earth & Environment, 7, 255. doi:10.1038/s43247-026-03242-3
As always, questions, corrections and speculations welcome in the comments here, or find me on mastodon at @ruth_mottram.

