I have tried to list all the different people and websites that provided material for this presentation, but if I have forgotten anyone, please do let me know and I will be more than happy to add an acknowledgement.
Normally I work on the continental or hemispheric scale, concentrating on Greenland and the Arctic. Next week, I have a new challenge, to go much more local than that, to the country and even county scale.
These inspiring women have showed themselves to be a formidable lobbying force over the years and subjects as diverse as bees and pesticides to care for people with dementia and the plastic bag tax. Years ago, I recall my mother coming home from a WI meeting and talking about the ozone hole, one of the earliest organisations to start talking about it, so it is not a particular surprise they now have a focus on climate change. They now have a climate change ambassadors programme.
Some of the many successful WI campaigners over the years from
Each area has to organise themselves and decide what they would like to do as part of this, so as partly a kick off to that process and as part of their science committee activities (It’s not all Jam and Jerusalem at the WI these days apparently) I will be presenting in Stafford at the county council chambers on the 6th July 1.30-3.30pm.
The Staffordshire County Council chambers
As part of the programme, Staffordshire County Council will also be sending a representative to talk about how the County is responding both in terms of managing impacts and reducing emissions towards achieving the UK’s targets.
It’s going to be interesting talking about climate change both observed and projected in the UK, happily, the UK Met Office is a world leader in this and the very friendly Mark McCarthy has provided me with a bunch of data to distil down and prepare some visualisations from (see graph below for a quick and dirty look at some data)
I also plan to talk about the basic science of climate change, how it has developed, how it is observed and how we make projections and what we expect for the UK and Europe over the next decades to centuries. I have called it questions and answers since I hope that people will ask questions as we go through. From talking to people everyday, it’s clear there are a lot of questions people have about climate change and the impacts and the sciense. I also hope to talk about some of the options we have for tackling emissions and how to deal with the impacts. Copenhagen is a great case study for both of these elements. This is quite a lot for a short hour or so talk, but let’s see how we get on!
A quick and dirty plot of avergae observed temperatures in Staffordshire (annual and seasonal means 1910 – 2015/2016) with thanks to UK Met Office and Mark McCarthy for providing the data.
It’s open to the public so if you happen to be at a loose end on a Wednesday afternoon and fancy it, I believe you can get tickets via the following secretary@sfwi.org or telephone 01785 223838.
In the mean time, should any members of the WI or indeed other Staffordshire residents who happen to be reading this, have any questions or ideas that they would like addressed specifically, please do feel free to leave a comment or ask me on twitter.
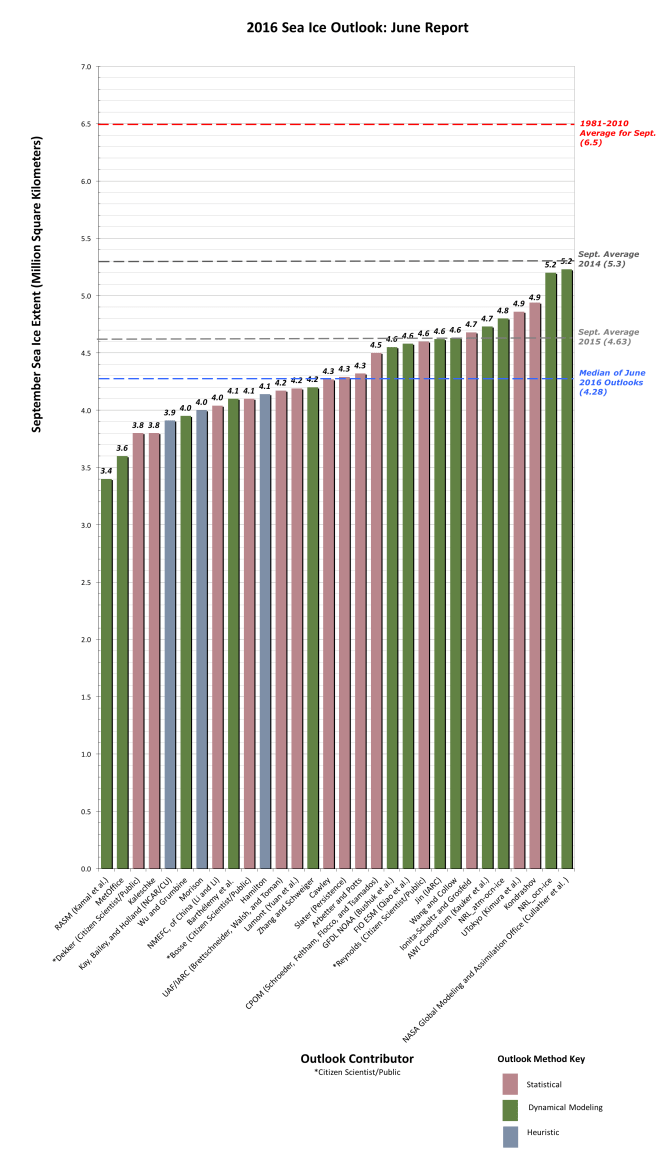
UPDATE: The Arctic Sea ice Outlook I mention in the post below has just been published for 2016. We will follow this up in September when the final results will be known, but here are the 30 entries using a rage of different techniques including sophisticated computer models, statistical estimates and what is kindly called “Heuristics” but which may be characterised as an educated guess by people who have been studying this field for a while…
Professor Wadhams has not contributed an estimate this year but it can easily be seen that none of the estimates reach as low as the putative 1 million square kilometres. Nonetheless the view of 27 expert climate scientists put forward by Kay, Bailey and Holland (pdf), not to mention the very sophisticated RASM model (one of the most sophisticated in this area, run by the US Naval Postgraduate school), put the September extent at a very low 3-4 million km2, in the same range as the record low of 2012.
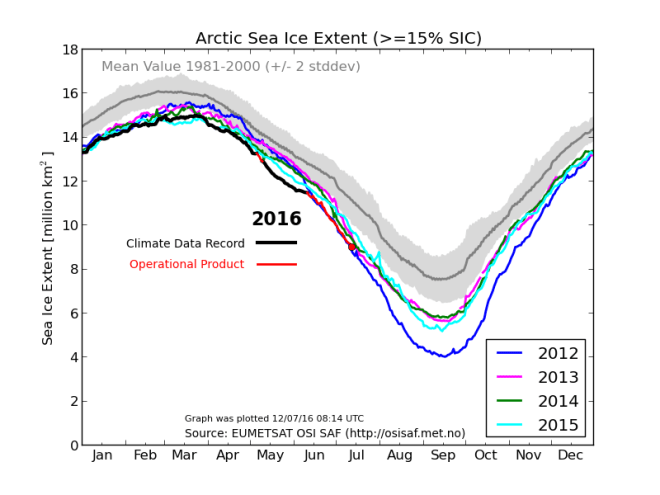
It will be interesting to see how low it does go. The latest results from the polar portal show that Arctic sea ice is currently still on the record low 2012 line but a careful look shows also that the 2012 and 2013 curves diverge around mid to late June. The year 2013 is pretty representative of a “new normal” over the last 4 years or so, it is therefore difficult to tell based on simply extrapolating along the curves which path 2016 is likely to follow.
The area covered by at least 15% sea ice in the Arctic from 1981 to present, the black and red curve shows the year 2016 and is updated daily on the Polar Portal
The Polar Portal has become part of our daily life at DMI where I work in the last few years, it combines detailed observations and models from the Greenland ice sheet, the Arctic sea ice and, soon hopefully, permafrost. I am particularly involved in the Greenland pages where we daily calculate the amount of snowfall and snow melt which gives us a surface mass budget and which we sum up over the year to work out what it means for the health of the Greenland ice sheet. This year has been especially interesting with an extraordinarily early start to melting driven by warm Arctic temperatures. Many records in Greenland have been broken in April, May and June. Spectacularly, last week Nuuk set a new temperature record for June that managed to last only 24 hours, before it was broken again.
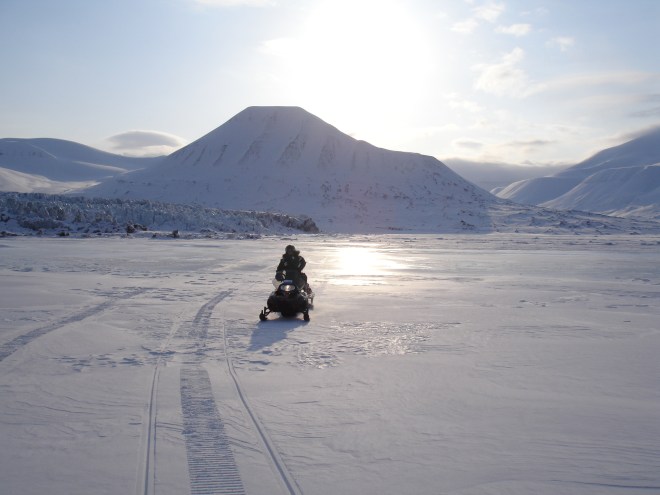
Crossing the sea ice in front of Paulabreen, a surge type glacier with a calving front in Svalbard
I trained as a glaciologist originally, but even then I came across sea ice and was first of all unnerved by it, crossing on scooters to visit glaciers in Svalbard, and then fascinated by it. Recently I have been working pretty closely with my colleagues in DMI who are sea ice scientists and I have learnt quite a lot. We even published a paper together in the journal Polarforschung earlier this year. Not only that, I am now part of a big ERC Synergy project known as ice2ice with scientists at four institutions in Bergen and Copenhagen working on the complex connections between sea ice, ocean, atmosphere and ice sheet in the Arctic. More on that another time, but suffice to say it’s fascinating work and I know a hell of a lot more about sea ice than I did even three years ago.
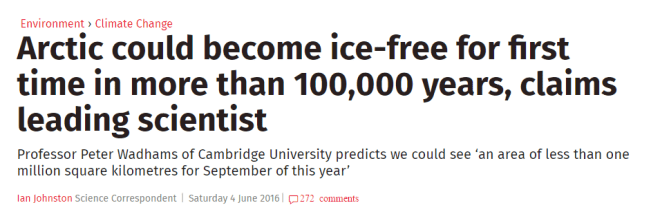
So when this news story crossed my email this evening courtesy a BBC researcher and journalist I knew pretty well straight away what it was about. Basically the scientist Professor Peter Wadhams had made some statements about the extent of Arctic sea ice which might be considered somewhat eyecatching.
Professor Wadhams is a well-known scientist who did some incredibly valuable and indeed ground-breaking early work on sea ice. More recently he has also done some very valuable work reconstructing thickness based on submarine observations during the Cold War (see below on why this is important). I well remember seeing him talk about this as a young graduate student, he is an excellent speaker and gave a very interesting and compelling talk. In the last few years he has made several statements that have been widely reported and perhaps misinterpreted, with regard to the future fortunes of the Arctic sea ice.
Now, I need and want to be clear about this. Most of the global climate models we use are not very good at reproducing the observed historical sea ice extent. They have improved significantly in the last few years but still struggle to reproduce the actual observed decline in sea ice area from satellites. And there are actually very good reasons why this should be. There are some very good stand alone sea ice models which have done a very good job and the key difference between these models is our clue. Sea ice models are generally partly forced with actual observations, or climate reanalyses which assimilate observations, so the atmosphere and the ocean are close to reality. Basically sea ice responds to weather, and if you have a more accurate weather driving your sea ice model you will get a better fit to the observations.
So, is Professor Wadhams correct? Will the sea ice “disappear” this year.
Well, it is pretty clear that given the changes we have already observed in the Arctic, as well as what we know about Arctic amplification and the general direction that anthropogenic emissions are heading in, that unless something changes pretty soon, we will likely see an end to a significant cover of sea ice in the Arctic at some point in the next few decades. But was does that actually mean?
Reading his actual comments in the article he appears to define 1 million km2 as “no sea ice” and that partly reflects how we define sea ice extent. Since most of the data sets use a cut-off figure (typically 15%) to define when a grid square or pixel is or is not a sea ice point. This is known as sea ice concentration and is really something of a hangover from the days when sea ice was observed from ships and an attempt was made to estimate how much sea ice in the area was around the vessel.
There are however lots of things that can affect sea ice extent, including winds and currents and melt ponds. The latter also affects how different algorithms assess the area that is or is not covered by sea ice. As there are a number of different sensors in use and a number of different algorithms processing that data, it is not entirely surprising that there actually a number of different estimates (I will use OSISAF) for how much of the Arctic is covered in sea ice. And this number will vary in years with more winds for example, or stronger ocean currents, sea ice will disperse faster. It is quite likely that much of the variability in sea ice area in recent years is at least partly attributable to different winds, as well as, for example in 2012, big storms that have arrived at just the right moment (or wrong one depending on how you look at it), to break up the sea ice into smaller, more easily transportable pieces.
As an aside, a better measure for how much Arctic sea ice there is actually present is sea ice volume. Unfortunately this is very difficult to measure, especially outside the winter freeze up season, though a research group at the UCL, centre for Polar Observation and Monitoring have developed a way to do so. Here for example is the most recent plot, which as you can see has not been updated since May 2016 due to the presence of melt ponds on the surface of the sea ice which the Cryosat radar cannot penetrate.
So 1 million km2 is probably a reasonable cut off for assuming an “ice-free” Arctic in the sense that it indicates that there will still be some sea ice drifting around (it always forms surprisingly quickly when the winter begins) in summer, even if it is dispersed.
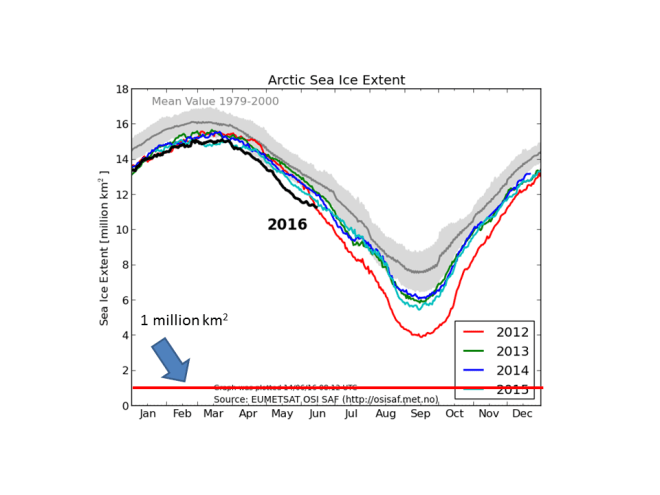
Over the last 40 or so years (we have good observations going back to 1979, it gets patchy after that), in September, when the area covered by sea ice is at it’s lowest, that extent has been between about 7 and 9 million km2, more recently that has dropped and 2012, the lowest on record had an extent of about 4 million km2, which you can see on the latest polarportal sea ice chart below.
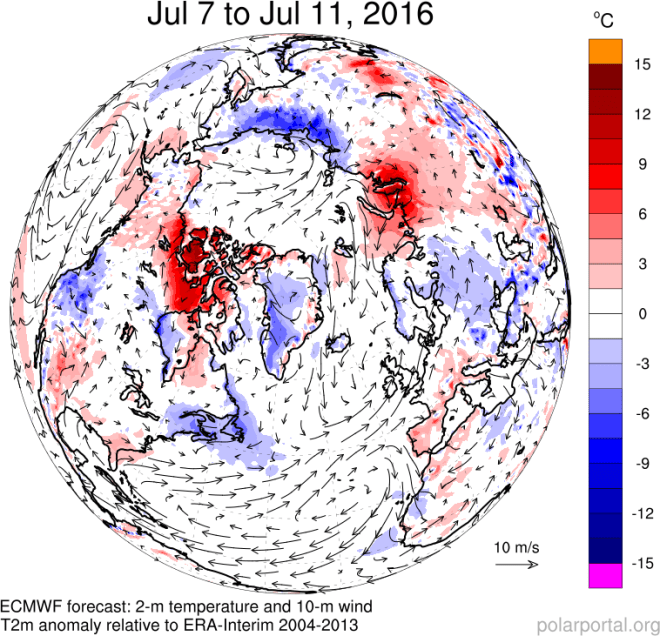
I well remember 2012, we had a large melt event over Greenland that year also, but it was still quite a long way from the 1 million km2 quoted by Professor Wadhams. Again, let me be clear, we are pretty sure that at some point on a time scale of a few years to a few decades, the Arctic will become “ice-free” in the summer time. We can predict this, even if we don’t know exactly when, since, as I hope is clear now, sea ice conditions are very dependent on the weather. The weather this year so far, at least this Spring has been very warm and congenial to sea ice melt. The big dive shown on the graph above is no mystery when considering some of the temperature anomalies in the Arctic, as shown also on the Polar Portal.
Nevertheless, the recent plots seem to show that the 2 metre air temperature in the Arctic is returning to close to normal and there is little reason to suppose that will change significantly anytime soon.
Having said that, weather forecasting has improved massively in the last few decades, a true quiet revolution, but we still do not know how the weather will pan out over the whole of this melt season. I am sure that at some point Professor Wadhams will be proved correct, but we do not know when and it is even possible or rather likely that we will have a few years where we switch back and forth between ice free and not ice free conditions. So, the answer to the question I pose above is probably no. But don’t bet on it remaining so for too long.
UPDATE: I recalled this morning on my way in to work that I had somehow failed to mention the Sea Ice Prediction network. This group of people under the auspices of ARCUS, gather predictions on y´the end-of-season sea ice extent ever year. The call for predictions for the 2016 season is now open. Many different research groups as well as one or two enthusiastic amateurs will post their predictions over the next few weeks. It is an interesting exercise, as you can see based on last year’s report (see also figure below), it is not the first time that Profgessor Wadhams has predicted a 1 million km2 extent in September, and his is the lowest (and least accurate) in the rankings.
Endnote: There has been quite an absence of posts from this blog recently. I have been too busy with work, family, travel and more recently the EU Referendum (for which I have been threatening a post for quite some time and may yet get around to before polling day). However, a question about Arctic sea ice has been flickering on the edges of my consciousness for a while now so this was a quick (EDIT: not so quick!) blogpost to try and address it when I should actually be writing something else…