Antarctic snows

Here’s a sentence I have been promising to write on this blog since at least March this year: Antarctica has been gaining ice since 2020. Not losing, gaining. Only 68 gigatonnes a year admittedly, actually a mere drop in the ocean, (or should that be crystal in the ice sheet?), given the vast size of the place, but an (almost) new paper that I worked on, led by the excellent Marlen Kolbe, explains why.
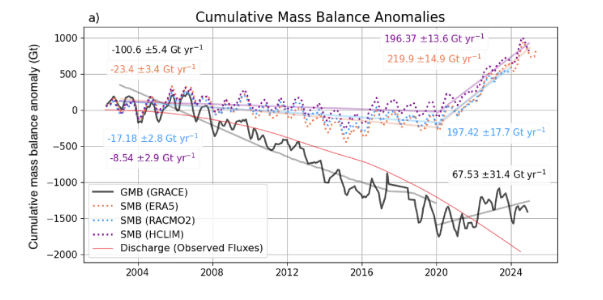
From Kolbe et al., 2026 Black: Monthly cumulative GMB anomalies from April 2002 to December 2024, based on GRACE (with respect to the mass as of 2011-01-01 before being subtracted from the GMB anomaly in April 2002 to show the changes since the mission launch). Dotted: Monthly cumulative SMB anomalies based on ERA5 from April 2002 to April 2025 (ERA5), December 2024 (HCLIM43) and December 2023 (RACMO2.4p), all with respect to the 1995-2010 mean, before subtracting their SMB from April 2002 (as for GRACE). Light straight solid lines indicate linear trend slopes from 2003 to 2019, and 2020 to 2024 (2023 for RACMO2.4p), with trends printed in the respective colour (all trend slopes are significant with p < 0.05). The small change in the grey line’s angle around 2017 reflects the 1-year GRACE – GRACE-FO gap. Red time series: Grounding line discharge from8 based on bed topography and velocity measurements from 1996 through to July 2024

First, the background. For most of this century, the Antarctic Ice Sheet has been losing mass at a pretty steady rate of around 100 Gigatonnes a year, pushing up global sea levels a small amount (About one third of a millimetre per year in fact, a little less than half the Greenland contribution for example). Antarctica is by far the biggest potential contributor to future sea level rise, so this is the number we all watch rather closely, as we also discussed the other week when the IMBIE paper came out. Then, around 2016, the satellites started telling us something odd: the losses were slowing down. And by 2020, the whole continent had swung into a small but definitely positive net gain — even though the ice flowing out to sea from West Antarctica’s glaciers kept accelerating throughout (the red curve in the figure above and the red areas in the discharge maps below).
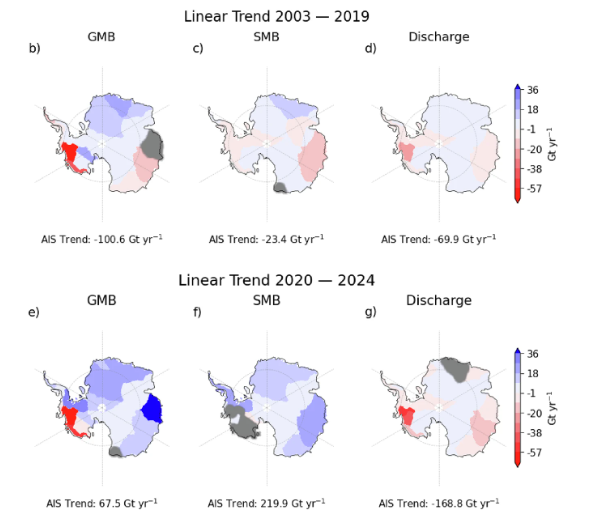
Maps show linear trends of GMB (c, f), SMB (d, g), and discharge (e, h) per basin for two time periods. Basins are greyed out where the trend is not significant (p < 0.05). 

So what was going on? The answer, it turns out, is snow. Rather a lot of it in fact, falling mostly in East Antarctica, but also in other events over the peninsula and in West Antarctica. But what was driving those enhanced snowfalls? The blue bits in the picture above show regions where there is an increase in snowfall

In what is either an incredible coincidence, or somehow a related process, at the same time the sea ice around Antarctica started to decline, big time:
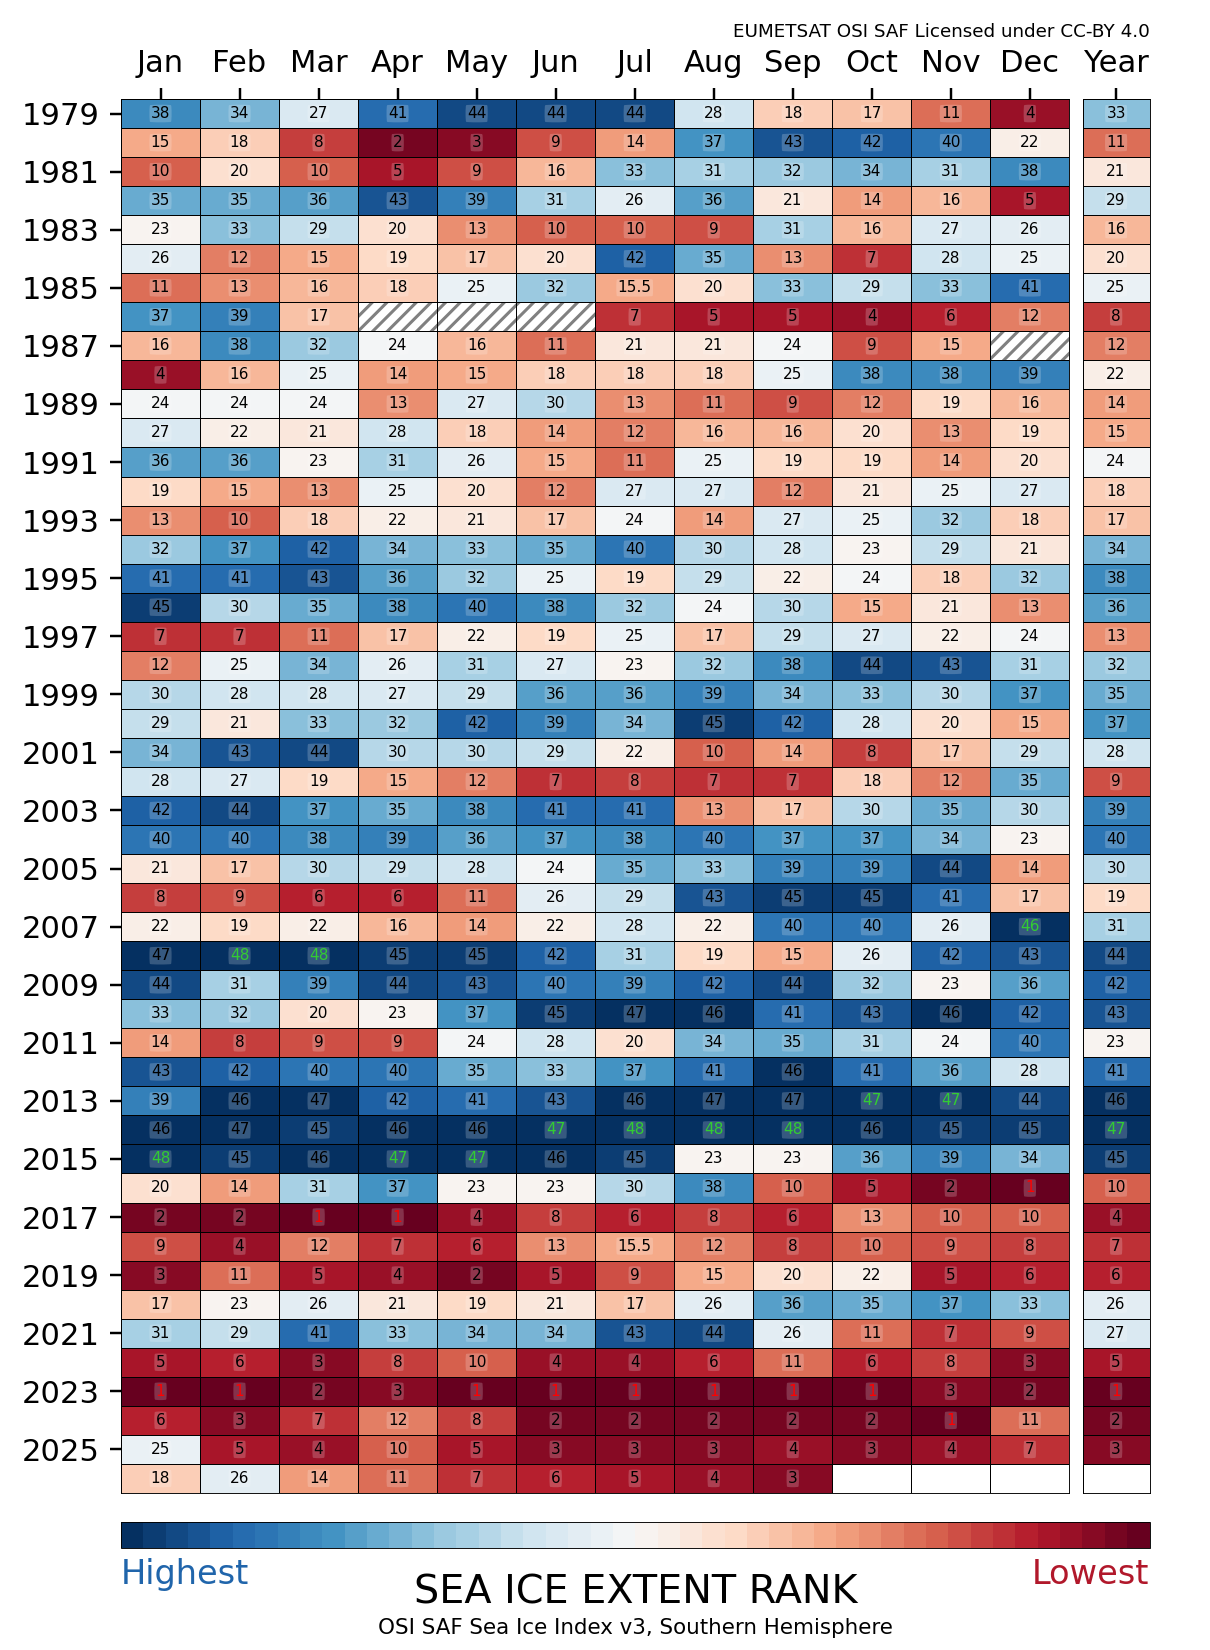
Rank of monthly sea-ice extent – Southern Hemisphere from our colleagues at EUMETSAT’s OSISAF facility

This was also an idea we explored in our Greenlandification paper, so my initial suspicion was that the loss of sea ice around the continent allowed more snow to reach the coast, both because more open water meant more evaporation from the sea, but also because less was lost over the sea ice. And a first sight of the statistics seems to support that.
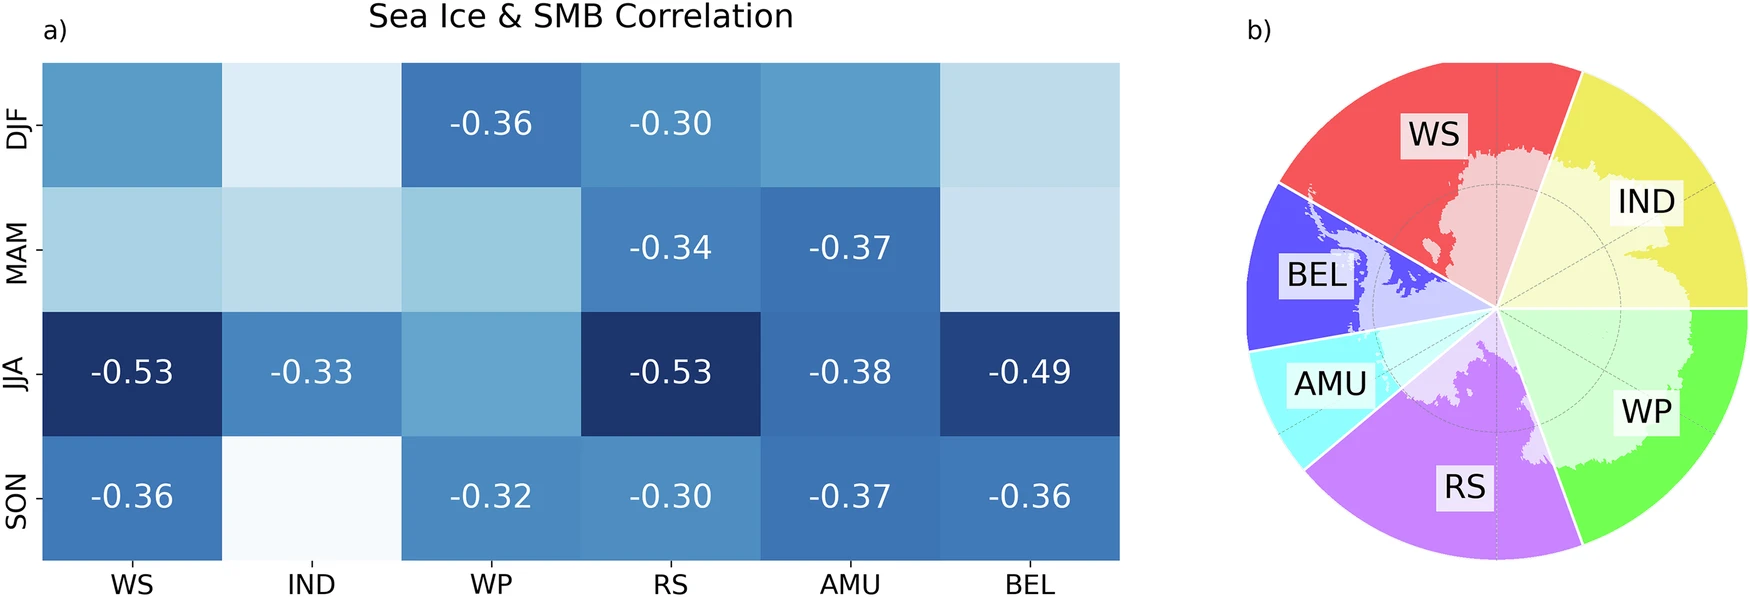
From Kolbe et al., 2026 a Seasonal correlations of basin-wide SMB and adjacent ocean-basin SIC for summer (DJF), autumn (MAM), winter (JJA), and spring (SON). The basins are shown in (b), where the transparent land areas represent the region where SMB anomalies are summed (excluding ice shelves), and correlated to the respective adjacent ocean basins. WS Weddell Sea, IND Indian Ocean, WP West Pacific, RS Ross sea, AMU Amundsen sea, BEL Bellingshausen sea. Boxes without numbers indicate insignificant correlations (p ≥ 0.05)

But it’s not very convincing – those correlation values are pretty low in most cases and of course, as we all know, correlation doesn’t really prove causality. So given we have a model, we could actually do something kind of cool, and run some experiments. In this case we added additional sea ice and we took sea ice away. And we showed that indeed there is a *small* effect of sea ice on the snow that reaches the continent.
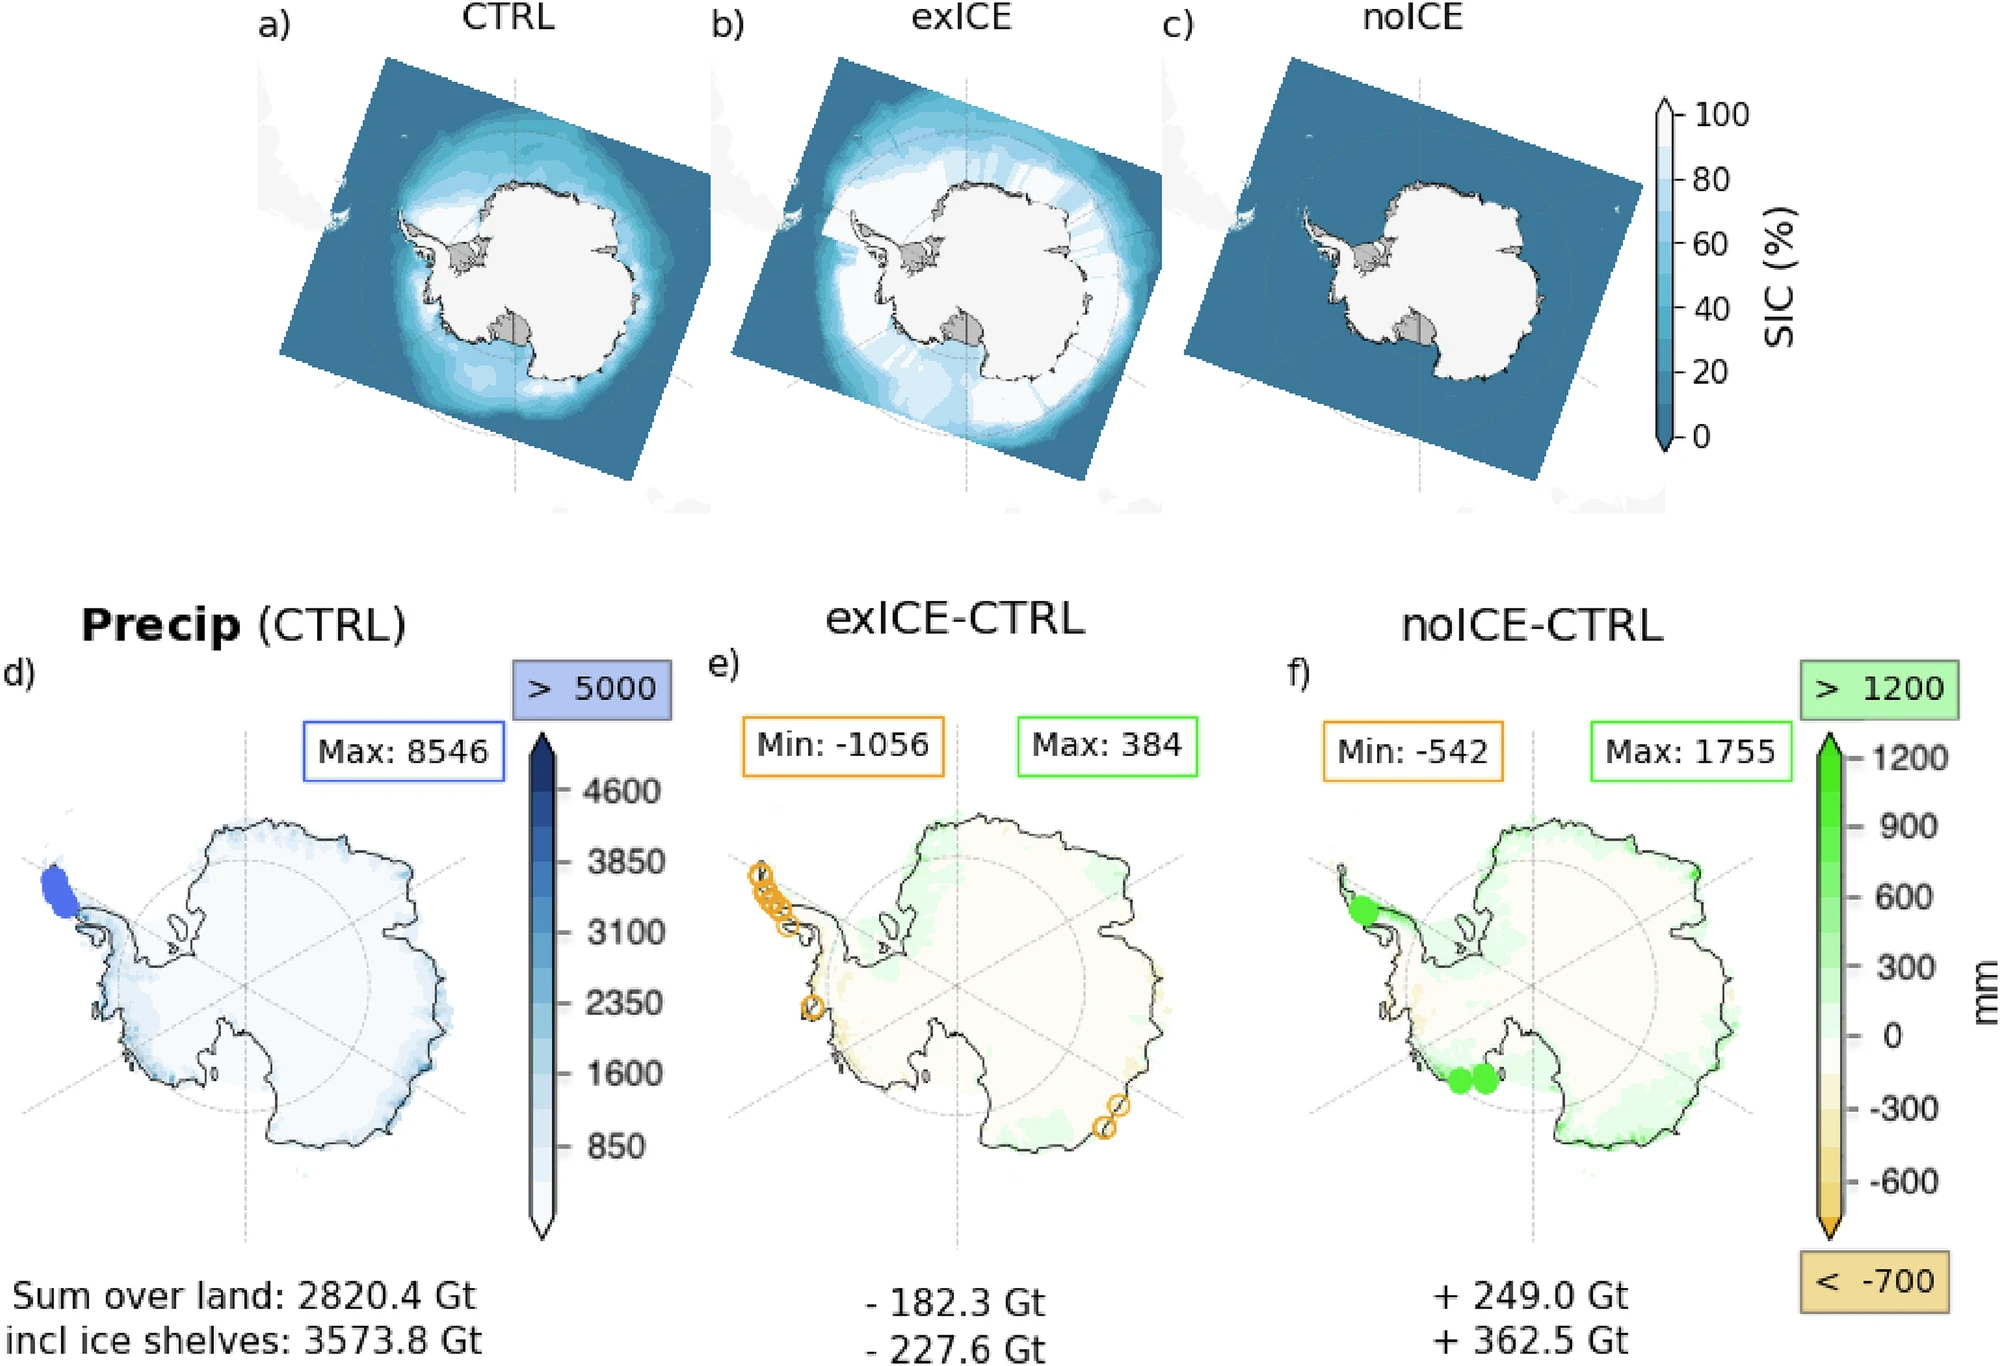
From Kolbe et al., 2026 Mean Sea ice concentration from June 2021 to July 2022 under (a) control conditions (CTRL), b enhanced sea ice (exICE), and c no sea ice (noICE) scenarios. d Total accumulated precipitation from June 2021 to July 2022 in the control simulation, and that of the noICE (e) and exICE (f) experiments minus the control run. Numbers beneath the plots give the total amount (or difference from) for the grounded ice sheet (AIS) and including ice shelves (AIS + IS). In d blue circles mark regions exceeding 6000 mm with the maximum value shown in the blue rectangle. In c, d, green circles mark regions exceeding 1500 mm and orange circles mark regions below −1000 mm with min/max values per plot are shown in the upper rectangles; 

But there is also likely another explanation..

Rivers in the sky

The snow delivery service comes in the form of atmospheric rivers. As the name indicates these aren’t rivers of water on the ground but long, narrow filaments of water vapour in the atmosphere, and they can carry astonishing amounts of moisture from the subtropics all the way to the Antarctic coast. When one of these slams into the steep edge of the ice sheet, all that moisture falls out as snow.

Think of them as the sky’s equivalent of a shower: most days the atmosphere delivers very little moisture or a relatively small even flow for a quick wash, but occasionally the power shower comes on and a single event dumps a month or even a year’s worth of snow in a day or two.
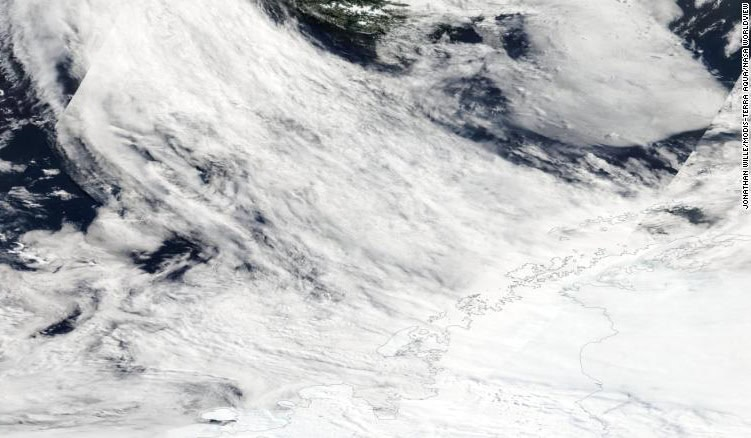
Atmospheric rivers originate from the southern Pacific Ocean and transport heat and moisture to the Antarctic Peninsula. Satellite image: Jonathan Wille/MODIS/NASA From the Polar Journal

Marlen’s analysis showed that from 2020 onwards, atmospheric rivers reaching Antarctica became both more frequent and more intense, helped along by stronger westerly winds (an effect of the southern annular mode, known as SAM to friends) and changes in the sea ice around the coast. East Antarctica got hammered with exceptional snowfall in 2022 in particular especially in Queen Maud Land and Wilkes Land and that extra snowfall more than compensated for the (still increasing!) ice loss from West Antarctica.

This is the surface mass balance doing its thing: SMB is a two-way term, with snowfall adding mass and melt and runoff removing it. In Antarctica there is very little surface melt and even less runoff so a few enormous snowfall years can push the whole continent’s ledger into the black, even while the dynamic term, what we call ice discharge in the paper, which only ever removes mass, has been accelerating.

So is this good news?

I’m afraid not, or at least, not necessarily.

We don’t know yet whether this gain is a temporary blip or a lasting feature of a warmer world. Atmospheric rivers are driven by weather patterns reaching Antarctica from the tropics and mid-latitudes, and the patterns that control them can shift as another recent paper (that came out after ours) also pointed out. A few years with fewer atmospheric rivers could easily tip the mass budget back to losses, even larger ones than before given the acceleration of ice lost in West Antarctica.

The satellite debt

None of this would be known without the GRACE satellites (and the successor, GRACE-FO), which measure changes in Earth’s gravity field and can effectively weigh an ice sheet from orbit. It never ceases to amaze me that we can now effectively put the Antarctic Ice Sheet on a bathroom scale, as a friend of mine once commented – we’re really living in the future with this stuff. The work was part-funded through ESA’s Climate Change Initiative (of which more in a later post), which has quietly built some of the most valuable long-term climate datasets we have, this study is one more reason they deserve support. Modelling was conducted in the course of our Horizon Europe OCEAN ICE project that is now sadly coming to an end (more of that anon).

The paper

Full credit to the immensely productive Marlen Kolbe, who led the work based on ideas we had while she was a visiting PhD student, and to my ace colleague Abraham Torres Alavez who ran the multiple experiments as well as to all my co-authors.

Kolbe, M., Torres Alavez, J.A., Mottram, R., et al. (2026). Atmospheric rivers and winter sea ice drive recent reversal in Antarctic ice mass loss. Communications Earth & Environment, 7, 255. doi:10.1038/s43247-026-03242-3

As always, questions, corrections and speculations welcome in the comments here, or find me on mastodon at @ruth_mottram.

Settling in..

It’s been a good start to the field season, incredible competent logistics, great field equipment, super helpful colleagues and incredible food by the station cook. For the first time ever I suspect I’ll be putting on weight in the field. But everything also takes a lot longer in Antarctica so little in the way of actual scientific results to report yet. Nevertheless we’ve some tantalising hints of some interesting processes and we’ve been settling in to the expedition frame of mind.

We had a very good flight from Oslo, a small delay in Prague notwithstanding, very friendly cabin crew and 3 seats each to lie across meant a relatively good sleep and a decent amount of work finalised on route.

Clouds over Namibia’s Etosha National Park. We basically crossed a third of the world to get here. A carbon debt I’ll be paying for years…

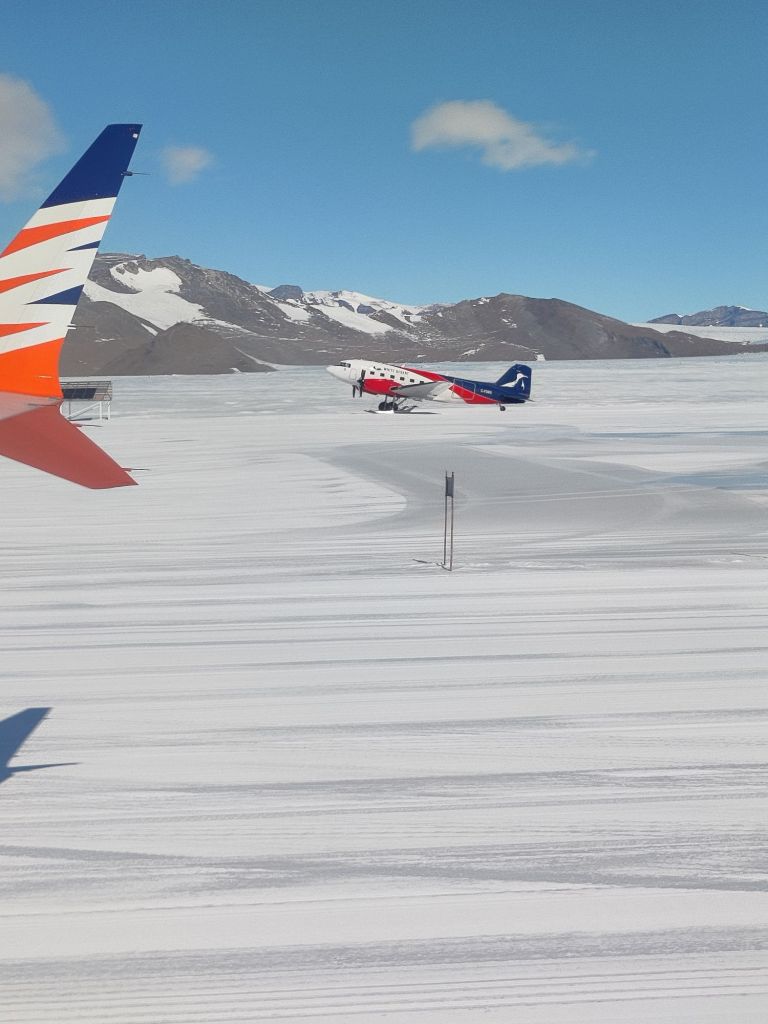
Similarly, in Cape Town, mostly spent in a hotel room finishing off reports, except for dinner and an occasional walk. And then a very smooth and easy 5 hour flight first to Troll, to be met by welcoming Norwegian colleagues and a vintage Basler (a DC3 airframe dating back to 1944, but with new engines – I’ve seen it in Greenland before – it still works!), that took us more or less directly to Wasa, where our Swedish colleagues met us on the glacier runway. And what a welcome! Everyone has been extremely helpful and very friendly.

The “vintage” Basler, an unpressurized aircraft. Very fun to fly in and beautiful views..

Operating in Antarctica is a bit like working in Greenland and also not at all like Greenland. In both places you have to be pretty flexible, self reliant and able to work in difficult conditions and across broad teams. It’s just much more extreme in terms of isolation, logistics, costs and everything else here in Antarctica.

The nunataks of Dronning Maud Land: it’s a big and very beautiful place

We are extremely fortunate to be so well- supported by such a great crew and it is important to me that we repay that investment with some excellent science results.

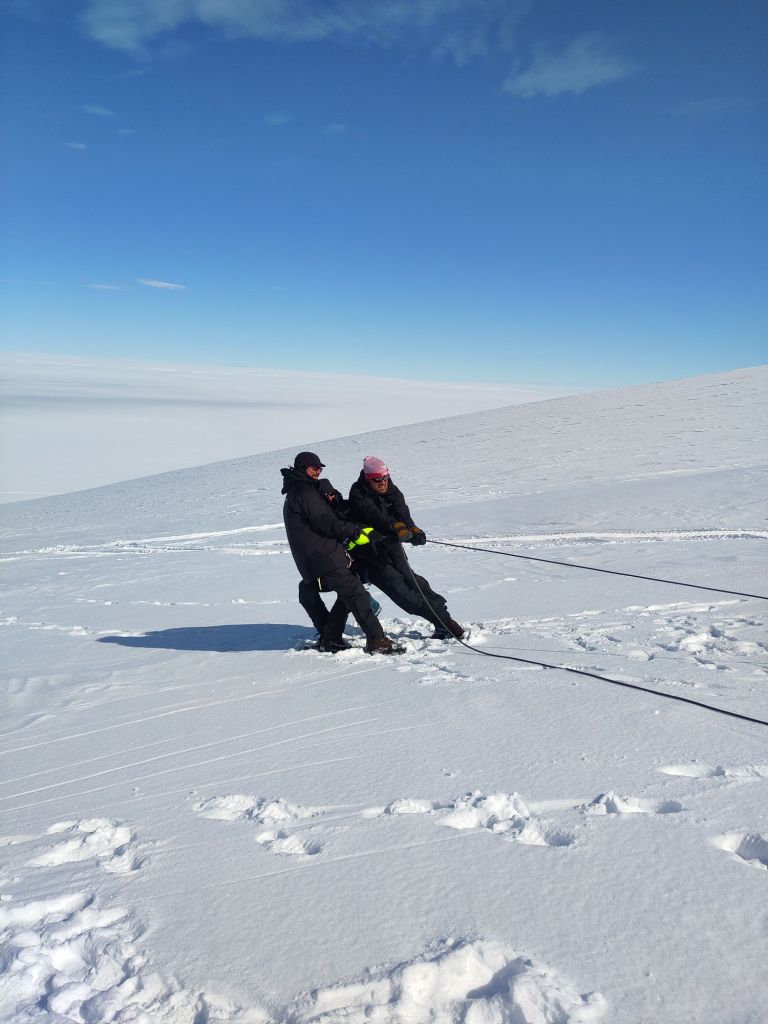
So far though, we’ve been laying the groundwork, getting our safety training done, testing some new coring equipment, unpacking and testing the LISA box and learning how to use the arks (a kind of plastic shell on skis that we will use for camping in while out of the station) and preparing for what I believe is sometimes called “deep field” (perhaps a touch melodramatic for what is basically camping).

Safety training: testing a snow anchor for crevasse rescue purposes

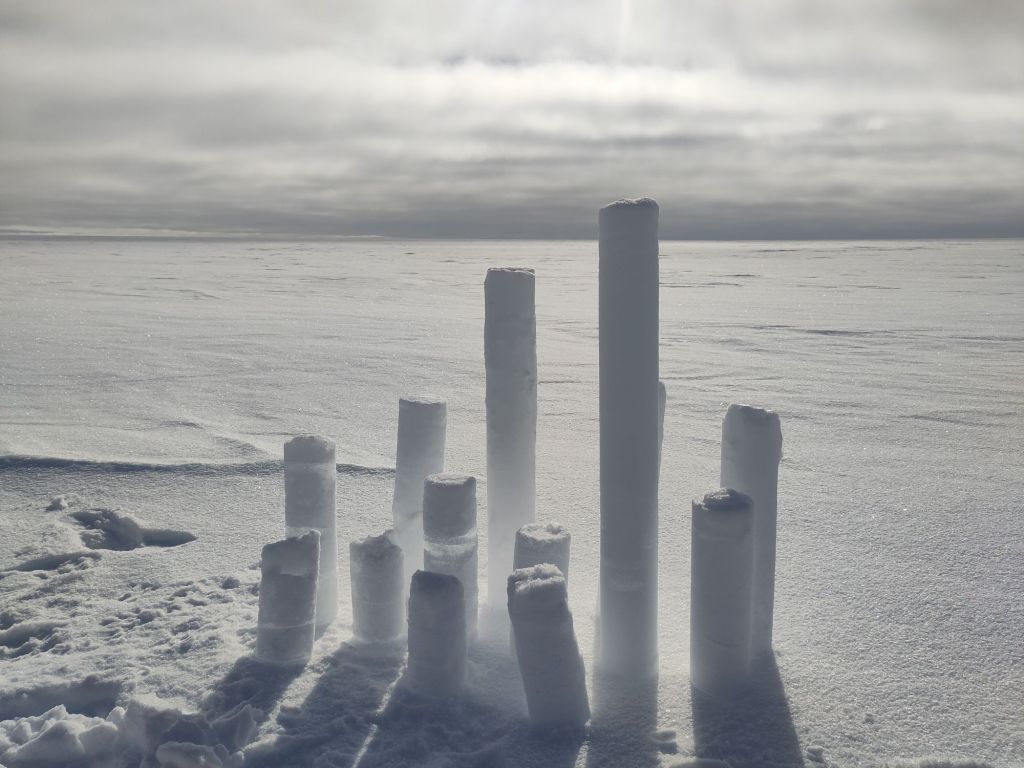
We’ve also tested some new drilling equipment, finding some very interesting firn features in the process, including several thick ice lenses in a region we didn’t expect.

Stacked firn cores on the glacier.

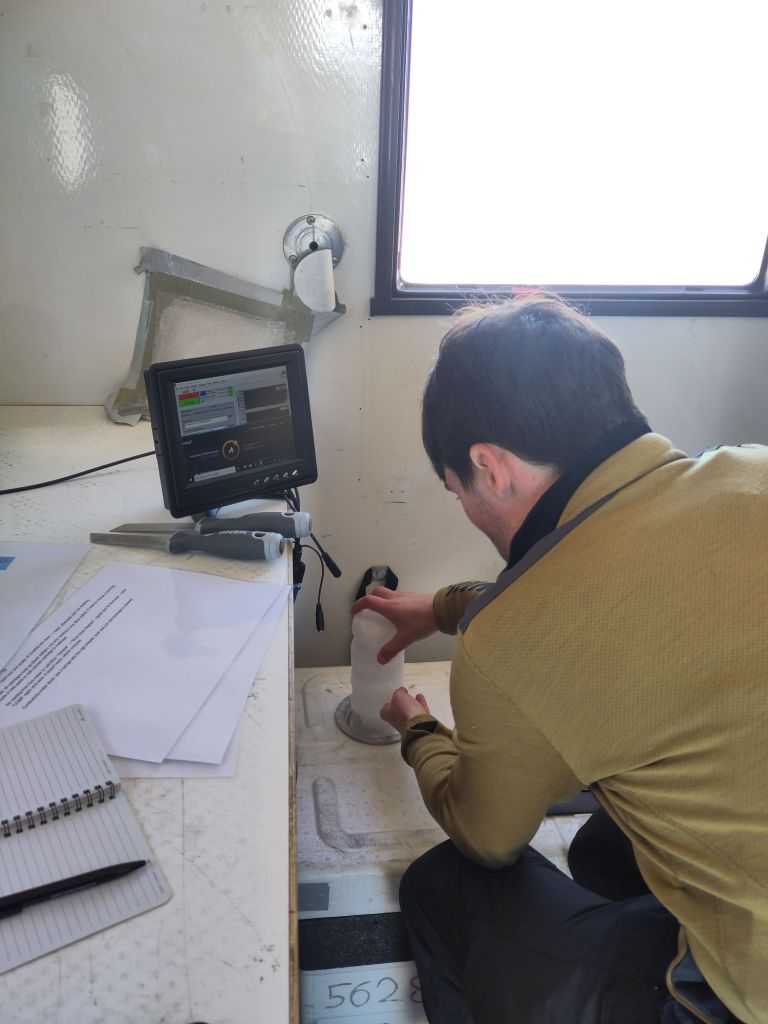
There have been a few anxious moments around our old friend LISA. She is a complex machine with many pieces that can go wrong but finally at 9.30 this evening Clément managed to get her working. In a tiny “lab” but one with a great view. A huge relief all round (and hopefully field operation will be more straightforward now we’ve had some practice).

  Tomorrow will be mostly packing up and preparation for a few days away, so Christmas Eve will likely find us camping out on a glacier somewhere working away. Weather permitting of course. So far we’ve been pretty lucky with that and we need to make the most of it while it lasts.

So that was a quick field update, it’s been pretty busy and a bit weird to think I’ve only been here 3 days so far. I’ve already slipped into field mode and slightly lost track of time.

The next update will probably be after Christmas, but I’m posting pictures as we go along to my pixelfed account. There are also some nice entries on the official iQ2300 expedition blog.

Celebration time: PRECISE

Quick update: our project website is now live where updates will be posted as we go…

The news is now officially out: I’m really delighted to announce the funding of our large project, PRECISE, by the Novo Nordisk Foundation.

The project is led by Professor Christine Hvidberg at the Niels Bohr Institute and there is a really nice interview with her on their website about our plans that’s worth a read. I’m co-PI and lead on surface mass balance processes and coupled climate models within the project so I thought it might be worth giving a quick overview of what we hope to achieve.

TL;DR? We will be improving estimates of and assessing the uncertainties in sea level rise projections from the two big ice sheets in Greenland and Antarctica.

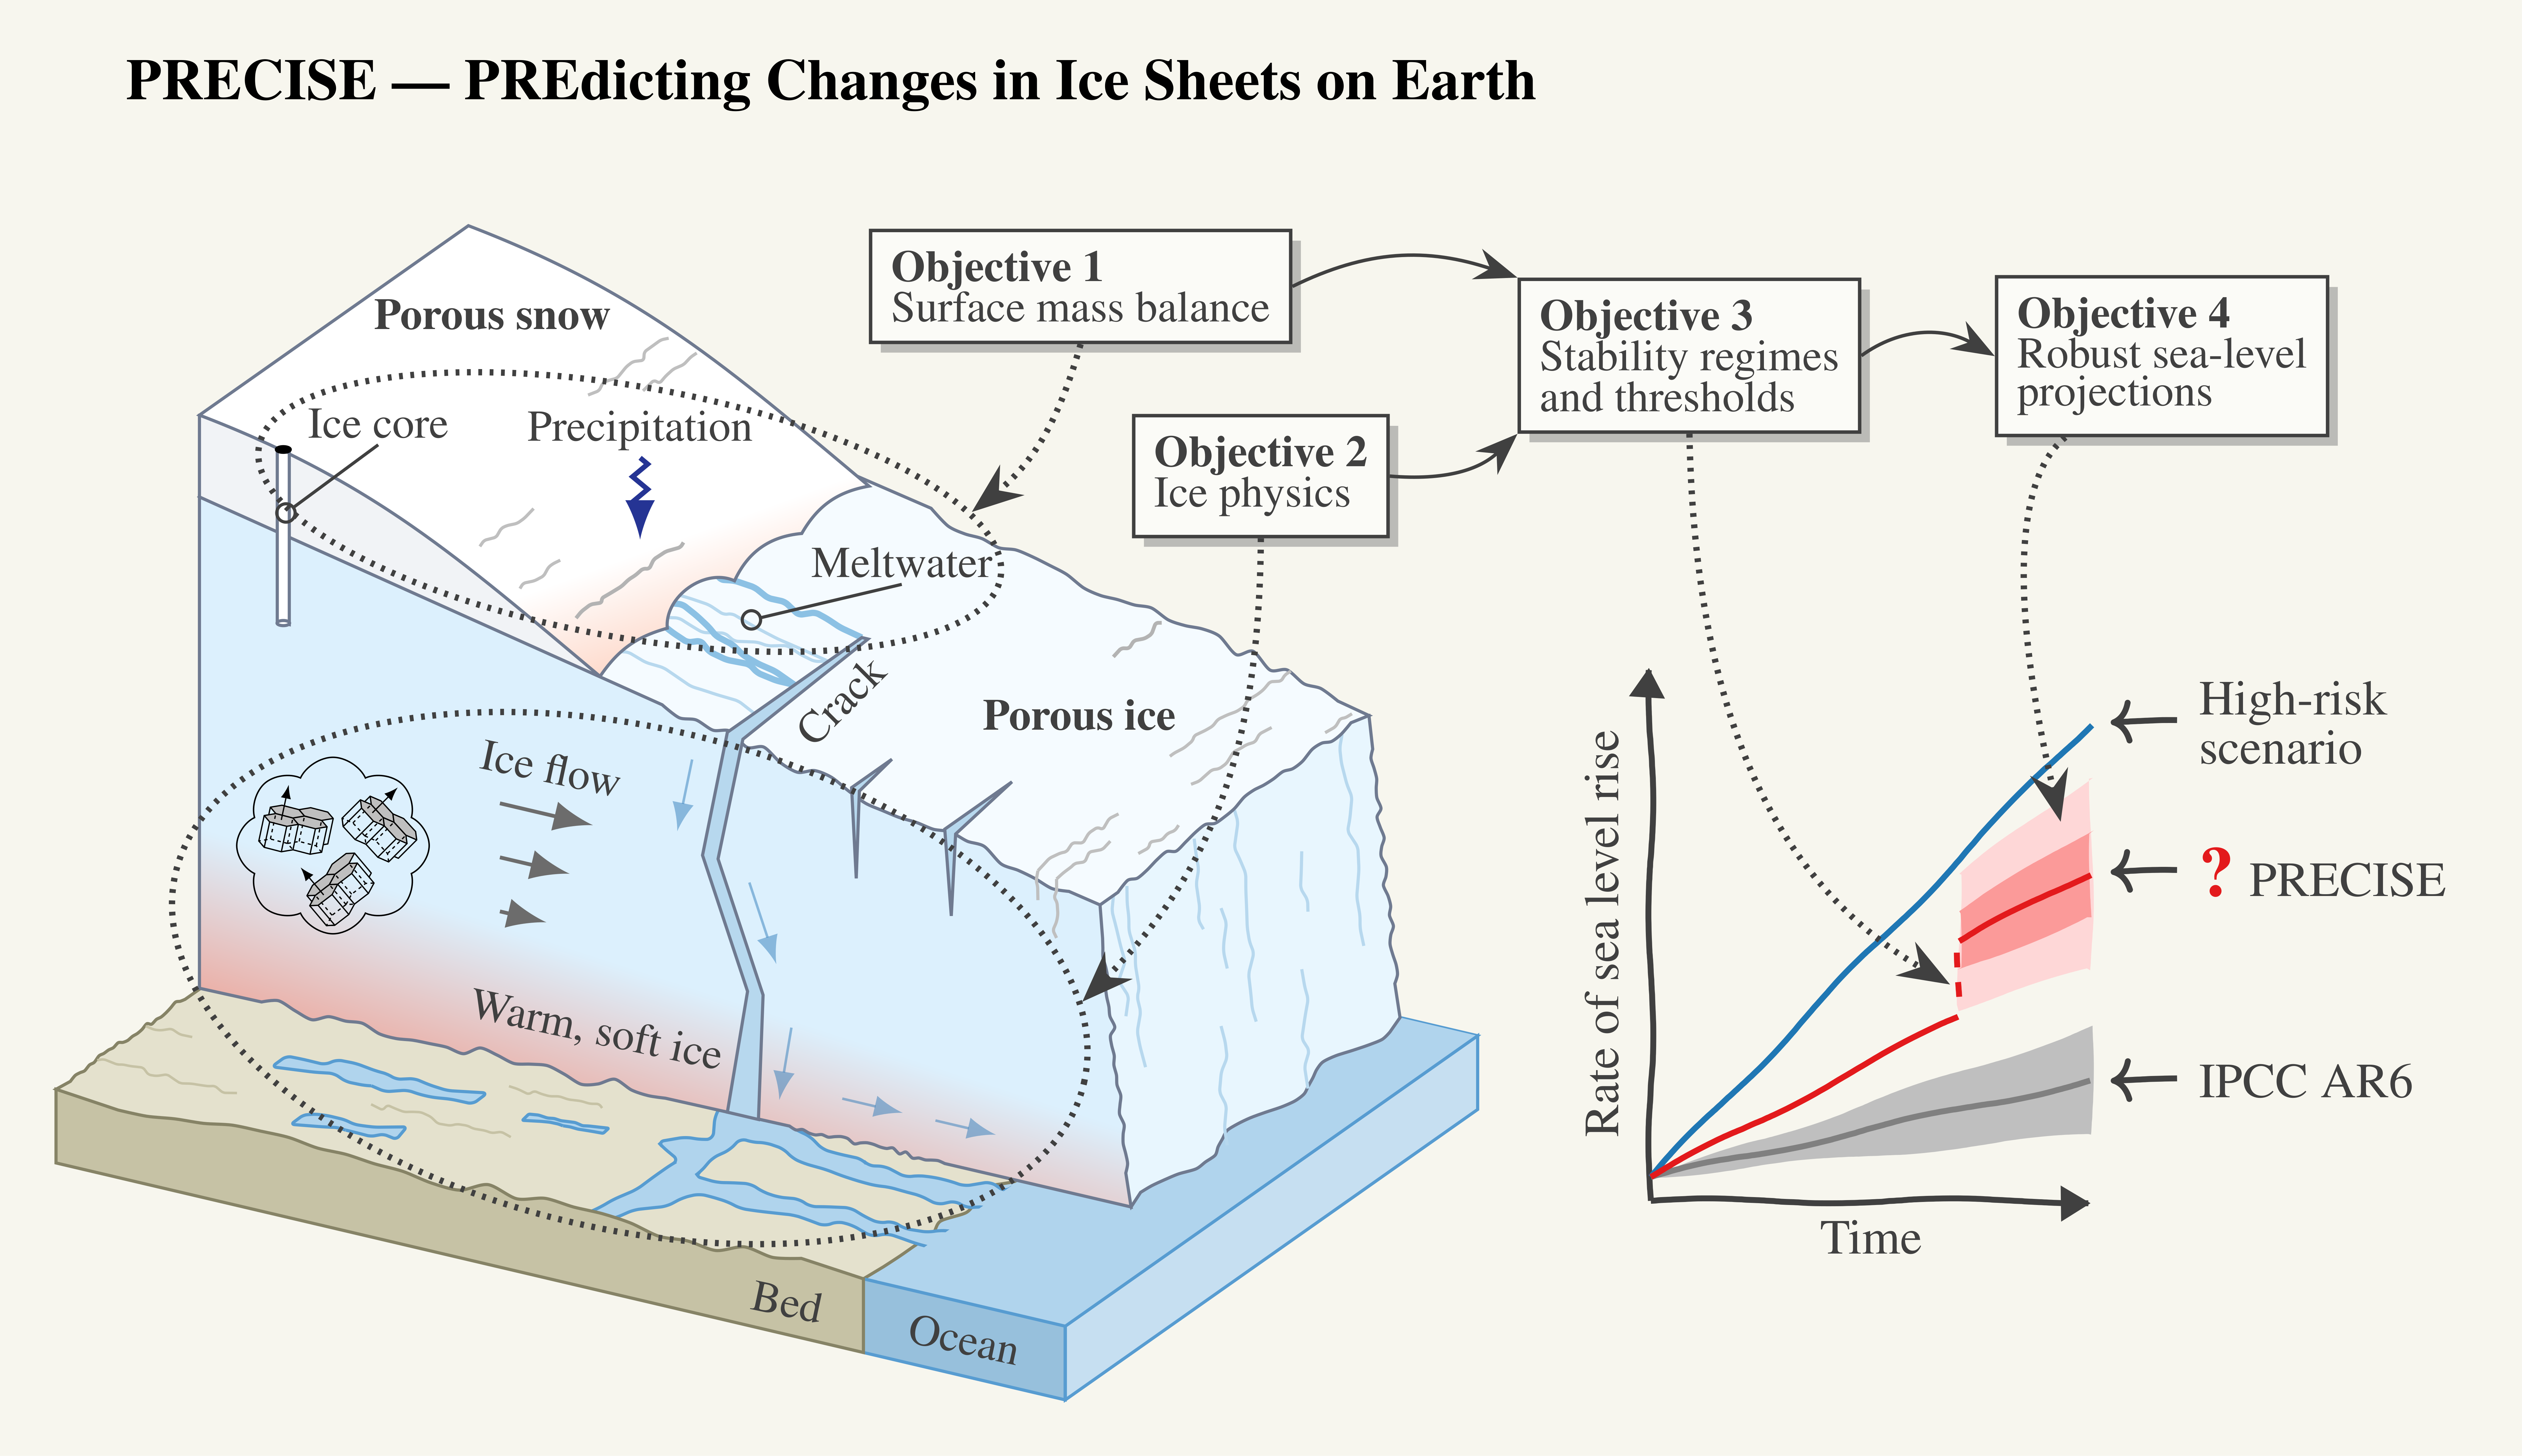
Every science proposal has a graphic like this somewhere showing how the whole project hangs together.
This is ours…

Slightly longer version: we’re using new approaches from materials science to incorporate “new” physics in ice sheet models. We’re also integrating in-situ observations and satellite data into our model frameworks and using these to train machine-learning tools. My work package will emulate our physics based numerical climate models to expand the ensemble and generate a statistical approach for assessing ice sheet stability as well as investigating important feedbacks between different elements of the earth system. Finally, we (or rather my colleague Christian Rodehacke and his postdoc) will run our coupled climate – ice sheet model (EC-EARTH-PISM), including these advances, to generate new sea level rise projections.

The outputs from all these experiments will be communicated and developed in collaboration with the Danish Klima Atlas (Climate Atlas) to ensure we are focused on the right kind of data and time periods for use by stakeholders and local populations when it comes to adaptation planning.

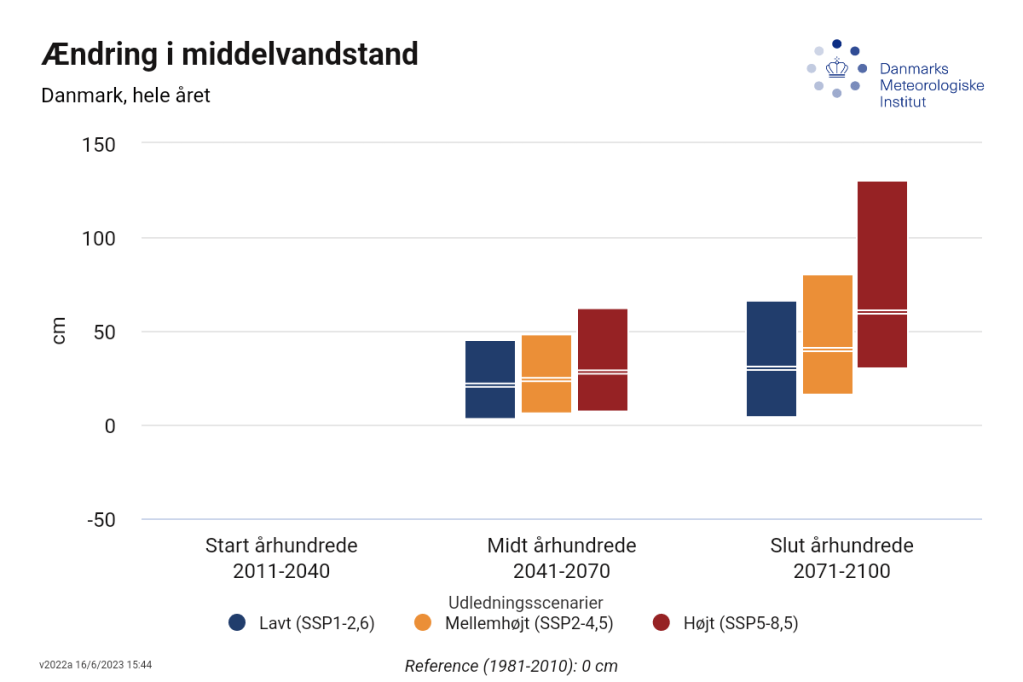
Current projections of change in average sea level around Denmark from the klima atlas

So why this project?

One of the most iconic images to come out of the last IPCC 6th asessment report (at least in my little corner of the climate science universe) is this one on sea level rise projections out to 2100.

Much of climate science has, at least to some extent been “solved”. At least in the sense that we understand the mechanisms and processes quite well and the remaining uncertainty is to some extent tinkering around the edges, often bound up with uncertainty on scenario, or related to impacts – there’s still quite large uncertainty on what will happen to the Amazon rainforest at different levels of emissions for example. However, sea level rise is really an exception to this. It’s very difficult to be sure that some very unpleasant surprises are really implausible.

We’re reasonably certain that global mean sea level will rise by at least 2 metres and around a metre by the end of this century with further sea level rise likely to continue perhaps for centuries.

The IPCC for example, concluded that sea level rise of 15 metres or more by 2300 can’t be ruled out, even if it seems rather unlikely. And this poses a pretty large problem to planners, politicians, stakeholders and providers of coastal services. Working out how far and how fast we expect the sea to rise is really our challenge.

But there is also a risk of abrupt and extreme sea level rise that could come round the corner to surprise us. However, it’s hard to know how likely this is or even how to evaluate that risk.

This has become something of a theme for me in the last few years. I have been working on the Horizon 2020 project PROTECT which very much focuses on the cryosphere and sea level rise, and I’m coordinating Horizon Europe’s OCEAN:ICE which focuses much more on the influence and feedbacks between Antarctic ice sheet and ocean.

Where PRECISE differs is that we have the flexibility within this project to develop new and innovative techniques that we’re not quite sure will work: especially the development of machine learning tools.

The EU science budget is a brilliant thing, but risky research is difficult to get through, the Move Nordisk challenge centres allow us to try really new and, yes, risky techniques. Though climate is a new topic for them, so we’re very much test bunnies in this new phase of funding science for them.

So what are we going to be doing practically?

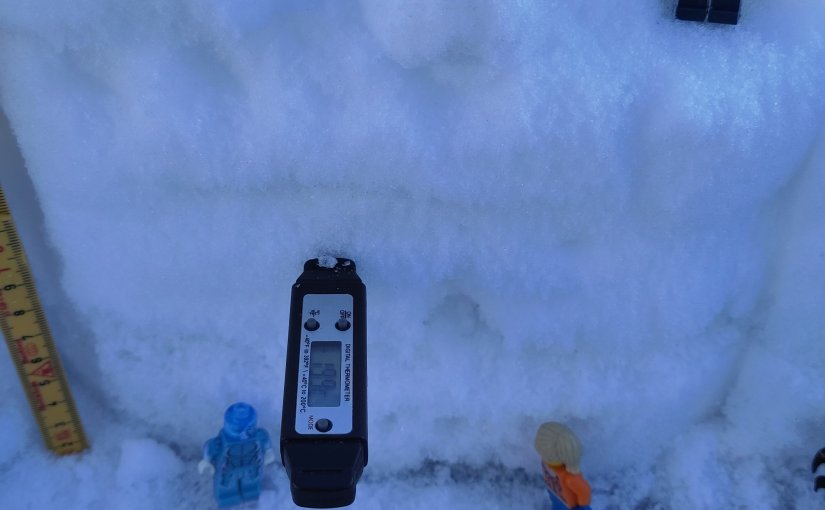
Measuring snow pack properties in Greenland, with the help of the Lego scientists..

Our partners at NBI include Joachim Mathiesen, Helle Astrid Kjær, Aslak Grinsted and Nicholas Rathmann. They will be focusing on assembling field data from both ice sheets, and developing new physical solutions for ice sheet models based on solutions from materials science. They will be looking at phase field approaches for ice flow, at new solutions for calving and ice fracture and integrating these into ice dynamical models. NBI will also be doing fieldwork to collect new surface mass budget (SMB) data from the ice sheets.

A new ice fracture appears, how to understand and model these is a key part of the NBI contribution in PRECISE project.

The SMB part of the work is part that I’m especially involved in. Not just in modelling SMB with our climate and weather models as we do on the polar portal but also in getting a much better understanding on the uncertainty in these models associated with precipitation (which is much higher than that associated with e.g. temperature, especially when it is snowfall). So new observations with a high time resolution will be key for improving our current snowpack models.

A shallow ice core, in this case sea ice, but part of the fieldwork will focus on taking more of these samples and doing isotope analysis on situ to get high quality data on snowfall accumulation

We will also be working on bringing regional climate emulators into use over both ice sheets to see how varying starting conditions will vary the outcomes. We know that on a chaotic system like weather starting conditions are key and emulators allow us to do many many more experiments than with our physics based numerical codes alone. It’s pretty cutting edge stuff right now but I know several groups are working on this – including this fantastic paper that recently came out of the Delft/Leuven group, which really shows what is possible

Our other collaborator, Hilmar Gudmundsson at University Northumbria Newcastle will be working on implementing these processes in ice sheet models and examining how plausible instability in ice sheet simulations is using ensembles of multiple model simulations. They will also be using and developing their ice shelf emulator to look at basal melting and investigating the potential instabilities in Antarctic ice shelves that could lead to abrupt sea level rise.

Finally, bringing it all together, our EC-Earth-PISM model will be deployed to do coupled climate and ice sheet simulations to see how the two ice sheets influence each other. This work will mostly be supervised by my DMI colleague Christian Rodehacke.

The project will receive 42 million Danish kroner in total (about 5 million euros) of which 8 million dkk will fund work at DMI, work to be carried out by 2 postdocs and a PhD student (so if this sounds like something you’d be interested in working on do get in touch) over the next 6 years from September. In fact most of the funding we have received will go directly to early career scientists, there is nothing in the budget for us seniors! Naturally this has some disadvantages, but given the rapidly aging population within Europe and European science, I see it as a positive and we have lots of cool summer schools, bootcamps and other networking activities planned that will hopefully reach out beyond PRECISE to the rest of the ice sheet – climate community.

So watch this space…

Out and about in Leeds..

I’ve been on holiday this last week and I’m combining the trip to the UK with a visit to colleagues and collaborators at the University of Leeds. I’ve also been nabbed while I’m in Leeds to give a wider interest talk at the Royal Meteorological Society Yorkshire branch in Leeds.

I’ll be discussing ice sheets, their contribution to sea level rise and how the future is looking. There may also be some nice photos from our fieldwork in Northern Greenland for those who like dogs, icebergs and snow…

If you’re in Leeds and fancy joining you’re most welcome to register and attend at this link.

In general, I’m trying to reduce my travel this year, last year, with all the rolled over meetings from the COVID times was disruptively busy with work travel, it makes it challenging to actually get the work done. So I think combining work and holidays and rolling up meetings into a block is the way forward.

Although I very much appreciate the opportunity to present online at various meetings, I’m less convinced about hybrid meetings where the purpose is mostly scientific discussions, that is something that works much better either all online or all in person in my opinion, but I think they work well when the aim is to present new and ongoing work (like EGU).

For those who are interested but can’t attend I will see if the talk tomorrow will be recorded and can be uploaded somewhere. Here’s the abstract:

Frozen Threats: Understanding the Role of Ice Sheets in Sea Level Rise

In this talk, we will delve into the world’s ice sheets and explore their importance in the climate system. Ice sheets are the largest stores of freshwater on the planet, their size and location means they influence our climate but their interactions with the atmosphere and ocean are complex. As the world warms, they will inevitable have an impact on sea level. Adapting to sea level rise will be one of our civilisations biggest and longest challenges, so understanding ice sheets is now of critical importance. They are also beautiful and fascinating environments in their own right. In this talk I will discuss some of the scientific challenges, but also show how far we have come in understanding ice sheets and glaciers.

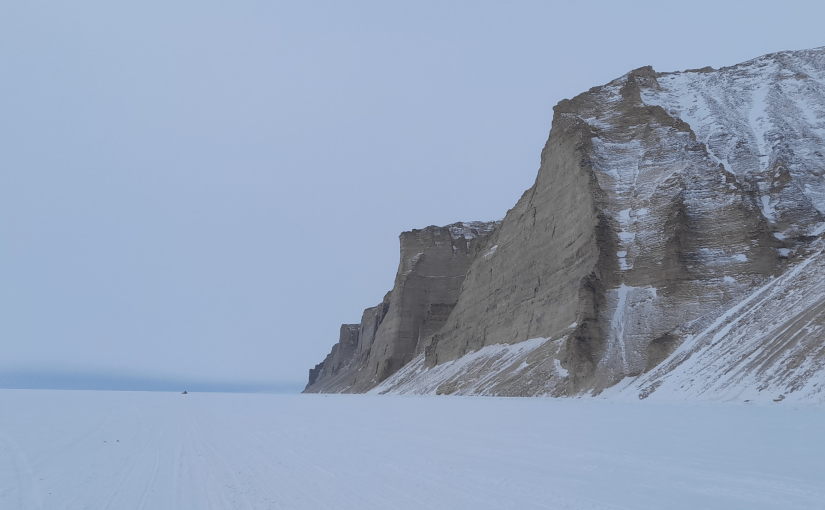
The Inughuit cliffs near Qaanaaq in Northern Greenland rising up above the sea ice. In the far distance a dog-sled is a small black speck.