Tag: ice sheet
Building the Next Generation…
Hands-up who is looking for a new and very cool job in ice sheet and climate modelling and developing new machine learning tools?
REMINDER: 4 days left to apply for this PhD position with me at DMI looking at Antarctic Ice Sheet mass budget processes and developing new Machine Learning models and processes.
UPDATE 2: The PhD position on Antarctica is now live here. Deadline for Applications 18th February!
UPDATE: It’s not technically a PRECISE job, but if you’re a student in Copenhagen and are looking for a part-time study job (Note that this is a specific limited hours job-type for students in higher education in Dnmark) , DMI have got 2 positions open right now, at least one of which will be dedicated to very related work – namely working out how well climate and ice sheet models work when compared with satellite data. It’s part of a European Space Agency funded project that I and my ace colleague Shuting Yang, PI on the new TipESM project, are running. Apply. Apply. Apply…
I’ve written about the PRECISE project before, our new Novo Nordisk funded project looking at ice sheets and sea level rise.
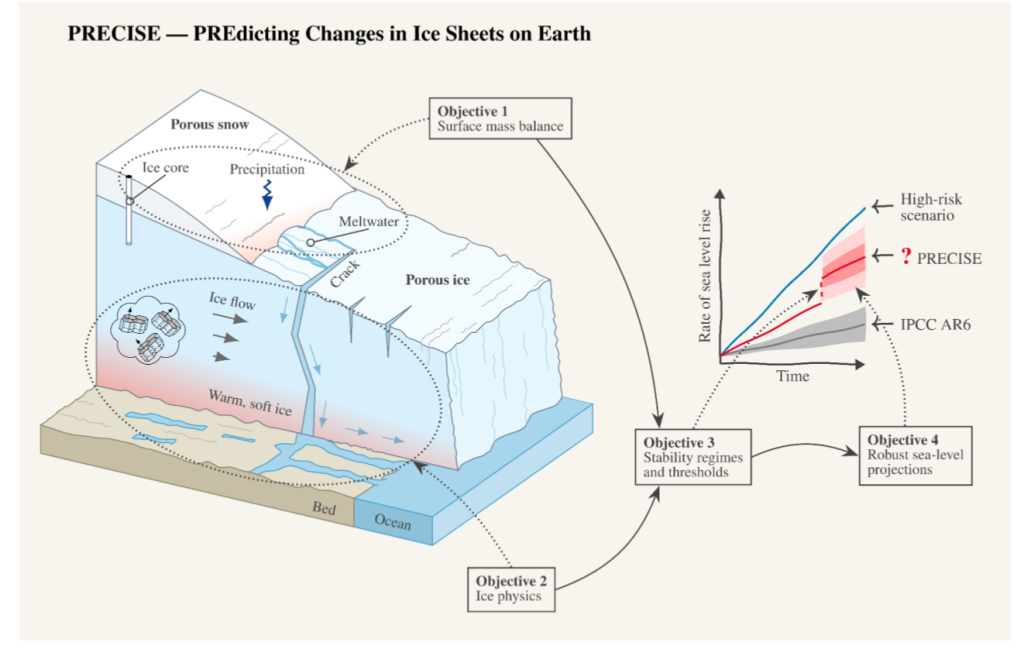
This is a quick post to announce that our recruitment drive is now open. We’re split across three institutes. We are two in Copenhagen, ourselves at DMI and the Niels Bohr Institute at the University of Copenhagen, and then the University of Northumbria in Newcastle, UK.
The PI at the Niels Bohr Institute is the supremely talented Professor Christine Hvidberg, aided by material scientist and head of the institute, Joachim Mathiesen. I am leading for DMI, and the Northumbria work is led by Professor Hilmar Gudmundsson. We are also very fortunate to have the talents of Aslak Grindsted, Helle Schmidt, Nicolas Rathmann and Nicolaj Hansen already on board.
The project is already very cohesive between institutes, we’ve been working together for some time already and know each other well.
We have a good budget for travel and exchanges between groups, workshops, symposia, summer schools and the like, but perhaps more importantly, all the positions are focused at the very cutting edge (apologies for the cliche) of climate and ice sheet modelling. We are developing not just existing models and new ways to parameterise physical processes, but we also want to focus on machine learning to incorporate new processes, speed-up the production of projections for sea level rise, not forgetting an active interface with the primary stakeholders who will need to use the outcomes of the project to prepare society for the coming changes.
There’s also a healthy fieldwork component (particularly in Greenland, I don’t rule out Antarctica either), and if you’re that way inclined, some ice core isotope work too. So, if you’re looking for a new direction, feel free to give me a shout. I’m happy to talk further.
Links to all the openings, will be updated as they come out, these are currently open and have deadlines at the end of January:
Newcastle: A three-year postdoctoral research position in machine learning emulators of ice-ocean processes
Newcastle: A two-year postdoctoral researcher (PDRA) position in subglacial modeling of the Antarctic Ice Sheet
Copenhagen (NBI) PhD Project in Greenland ice sheet climate and precipitation variability
Copenhagen (DMI) PhD Project in Antarctic ice sheet surface mass budget (also keep an eye here, where there are also some other interesting jobs announced)
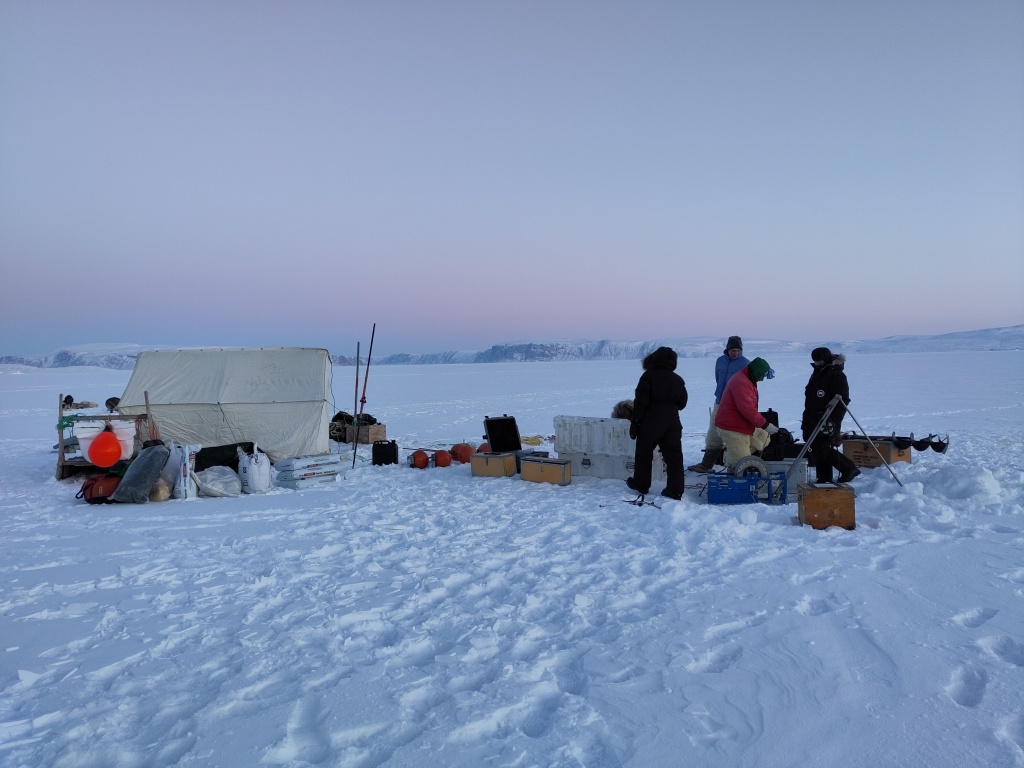
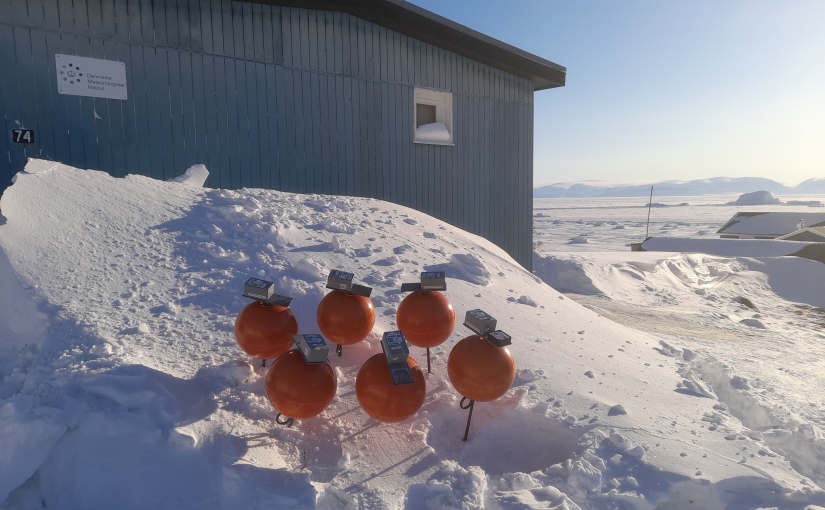
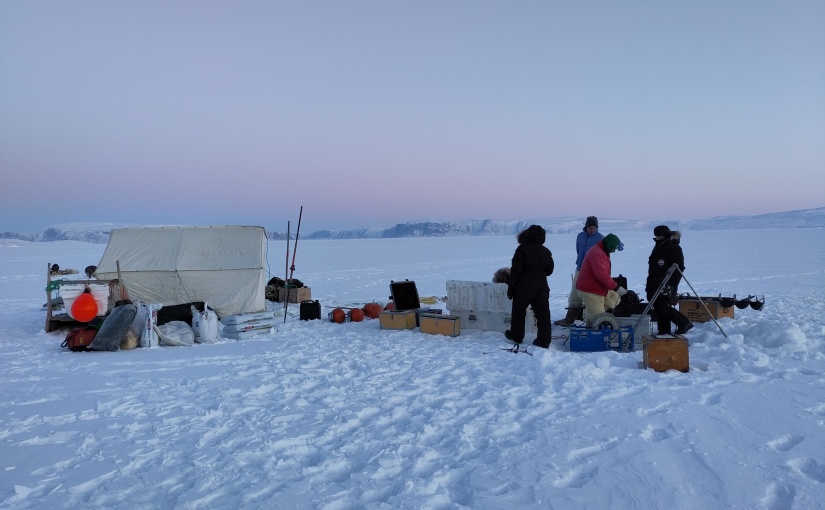
(Photo credit: Ruth Mottram, DMI)
Sea Ice loss in Antarctica: Sign of a tipping point?
The Danish online popular science magazine is currently running a series on tipping points in the Earth system with a series of interviews with different scientists. They asked me to comment on the extraordinary low sea ice in Antarctica this year. You can read the original on their site here. But I thought it might be interesting for others to read in English the piece which is a pretty fair reflection of my thinking. So I’m experimenting a little with DeepL machine translation which I consider much more reliable that google’s competitor. I have not edited anything in the below!
I have been promising a piece on West Antarctica for a while – which I’m still working on, but hopefully this is interestign to read to be going on with!
A sudden and surprising loss of sea ice in Antarctica could be a sign that we are approaching something critical that we need to prepare for, warns an ice researcher from DMI.
The climate seems to be changing before our eyes.
2023 has seen record high temperatures both on land and in the ocean, which you can read more about in the article ‘Is the climate running out of control like in ‘The Day After Tomorrow’?
In Antarctica, there has been a sudden, violent and in many ways unexplained lack of sea ice, which normally melts in the summer and re-forms in the winter.
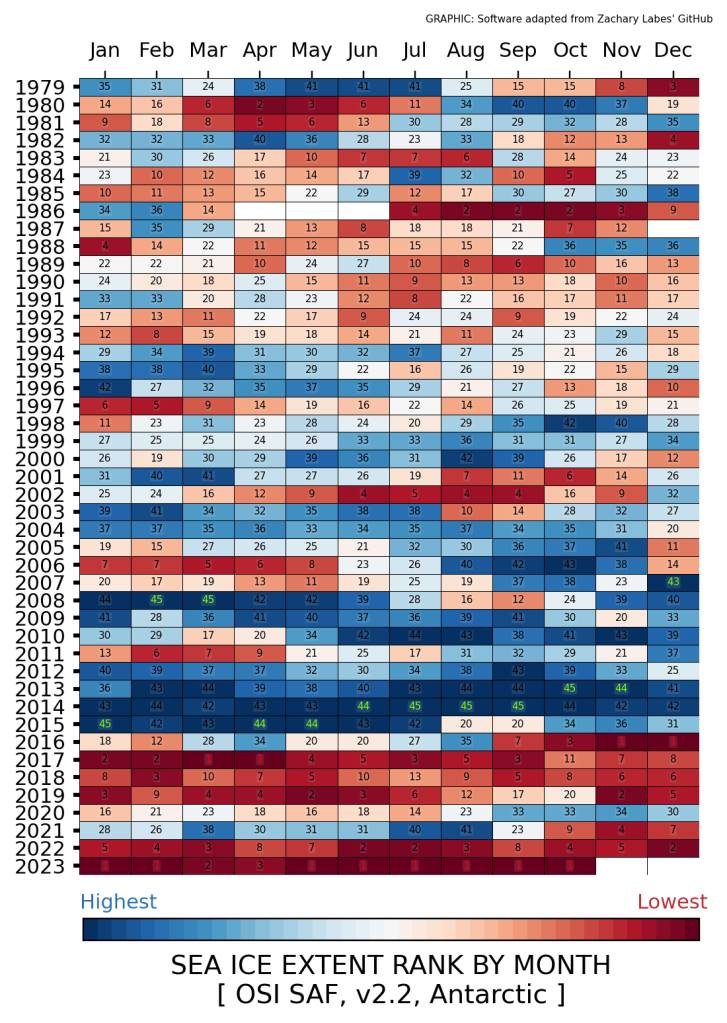
Since then, some of what was lost has been recovered, but when the sea ice peaked in September 2023, 1.75 million square kilometres of sea ice was still missing. This is equivalent to about 40 times the area of Denmark.
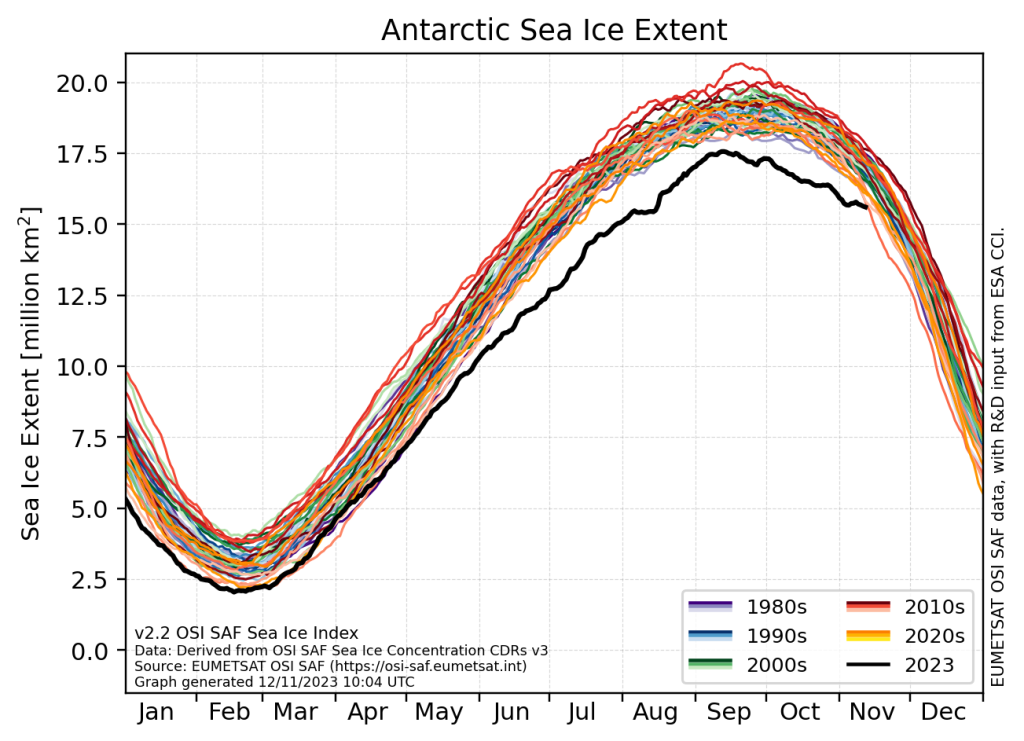
This is by far the lowest amount of sea ice ever measured in Antarctica.
“The melting sea ice in Antarctica is not unexpected in itself, because we have long predicted that it would disappear due to global warming,” Ruth Mottram, senior climate researcher and glaciologist at the Danish Meteorological Institute (DMI) tells Videnskab.dk.
The climate seems to be changing before our eyes.
2023 has seen record high temperatures both on land and in the sea, which you can read more about in the article ‘Is the climate running out of control like in ‘The Day After Tomorrow’?
“But to suddenly have a very, very large disappearance like that is a big surprise. We can’t explain why it happened, and our models can’t recreate it either,” she says, but adds that over time, the models are getting closer to reality.
Disturbances in the Earth’s system are probably connected
Videnskab.dk has in a series asked five leading Danish scientists to assess the state of the climate from their chair – in this article Ruth Mottram.
Ruth Mottram is head of the European research project OCEAN:ICE.
The OCEAN:ICE project
The researchers in OCEAN:ICE, led by Ruth Mottram as principal investigator, will take measurements below the ocean surface. This will provide more knowledge about the temperatures in the ocean around Antarctica.
They will also calculate how fast the ice is melting in Antarctica due to ocean processes and warming in the air. They will also investigate what the lack of sea ice means for the rest of the Antarctic system.
Ruth Mottram cites as examples:How does it affect ecosystems? For example, many animals feed on the small crustacean krill, whose life is affected by sea ice. Will more waves now reach the Antarctic ice sheet and perhaps lead to more icebergs and more melting? Will glaciers and icebergs become more sensitive to heat? Or, on the contrary, will less sea ice trigger more snow over the continent, which could even stabilise the glaciers?
More specifically, researchers will focus their efforts on seven areas, which you can read more about on the OCEAN:ICE website.
In the project, researchers will, among other things, take measurements under the sea surface in Antarctica to gain more knowledge about how the ocean and ice interact.
Is melting sea ice linked to warm water in the Atlantic?
In the North Atlantic, sea surface temperatures in some places have been as much as five degrees above normal.
To an outsider, it seems obvious that this could have something to do with melting sea ice.
However, according to Ruth Mottram, the two factors are not necessarily directly related. Sea ice in Antarctica melts from below. Therefore, the temperature at the bottom of the sea is far more important than the temperature at the surface.
“But if there’s one thing I’ve learnt over the past 15 years working at DMI, it’s how interconnected the whole world is. So I think we’re seeing some disturbances throughout the Earth system that are unlikely to be completely independent of each other,” she says to Videnskab.dk.
Ocean Professor Katherine Richardson made the same point earlier in the series. You can read about it in the article ‘Professor: The oceans are warming much faster than expected’.
Lack of knowledge and observations
Ruth Mottram emphasises that far more observations from Antarctica are needed before we can say anything definite about the causes of the rapidly shrinking sea ice, but: “It could indicate that the Antarctic sea ice has a critical tipping point like the Arctic, where for a number of years we see a slow decline year by year, and then suddenly it drops to a new stability where it is very low compared to before.””But we don’t know, because there are parts of the system that we don’t understand and that we haven’t observed yet,” explains Ruth Mottram.
Possible reasons why sea ice is disappearing
Ruth Mottram talks a lot with international colleagues about why the sea ice is currently experiencing a significant decline.
She explains that there are different theories, for example that warmer water from below is coming into contact with the sea ice and melting it from below, and that warmer air may be feeding in from above.
In Antarctica, the direction and strength of the wind has a big impact on the state of the ice (click here for a scientist’s timelapse of how Antarctic weather changes rapidly).
Perhaps the sea ice has been hit by “a very unfortunate event”, where it is both being hit by warm water from below and being affected by weaker winds from changing directions, which is holding back the recovery of sea ice.
Again, more research is needed.
Melting ice also contributes to sea level rise, and the Earth is actually designed so that melting in Antarctica hits the northern hemisphere much harder than melting in Greenland. So, bad news for the ice in Antarctica is bad news for Denmark.
Even more bad news is on the horizon.
The natural weather phenomenon El Niño looks set to get really strong over the next few months. A so-called Super-El Niño will likely only make the world’s oceans even warmer.
“We know that the ocean is going to be really, really important in the future in terms of how fast the Antarctic ice is melting and what that will mean for sea level rise,” says Ruth Mottram.
We can’t just wish the world would look different
The climate scientist does not fear huge increases or a violent change in climate overnight, as depicted in the 2004 disaster film ‘The Day After Tomorrow’. She points out that even abrupt shifts in the Earth’s past climate have occurred over decades or centuries, not a few months or years. Still, Ruth Mottram thinks it makes sense to start talking a little more openly about how we tackle severe sea level rise – which on a smaller scale can still be sudden – and large-scale climate change.
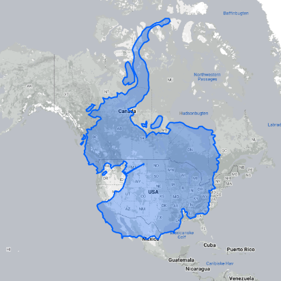
The Antarctic ice sheet is the largest on the planet
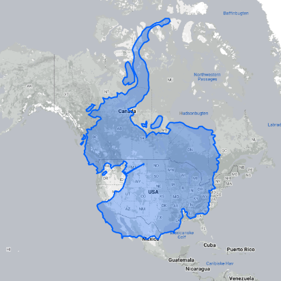
The Antarctic ice sheet contains around 30 million cubic kilometres of ice. This means that around 90 per cent of all fresh water on Earth is frozen in Antarctica.
If all the ice sheet in Antarctica melts, the world’s oceans will rise by around 60 metres. Even if we stay within the framework of the Paris Agreement, we risk that melting Antarctic ice from Antarctica will cause sea levels to rise by 2.5 metres.
Ruth Mottram notes that the more we exceed the limits of the Paris Agreement, the faster sea levels rise – and slower if we act quickly and stay close to the set limits of preferably 1.5 and maximum 2 degrees of temperature rise compared to the 1800s.
“The Earth’s climate system may be shifting towards a new equilibrium, which could result in a different world than we have grown up with,” continues Ruth Mottram.
“It is already affecting us and will do so increasingly in the future. That doesn’t mean it will be a total disaster, but we will probably get to the point where we have to adjust our lifestyles and societies.”
“It won’t necessarily be simple or easy to do so, but we can’t just wish for the world to be different than it is,” says Ruth Mottram.
In another article in Videnskab.dk’s climate series, Professor Jens Hesselbjerg Christensen notes that the world’s finance ministers – including Denmark’s – must pull themselves together and find money to slow climate change by, among other things, putting a cap on greenhouse gas emissions.
“We are in the process of allowing future generations to accept that large areas of land will become uninhabitable because the water level rises too much,” he says.
‘Bipolar’ researcher: Keep an eye on Greenland too
In the short term, Ruth Mottram is interested in finding out what the consequences of El Niño will be and how Antarctica will change over the next few years.
But she also has her sights set on Greenland.
“Because there have been so many weather events elsewhere, it has gone a bit unnoticed that we’ve had a really high melt season in Greenland this year.
“It can give us the opportunity to see very concretely how weather and climate are connected. That’s why the next few years will be really interesting in Greenland,” says Ruth Mottram, who has also conducted research in the Arctic for many years.
The next article in Videnskab.dk’s series on the state of the climate will focus on Greenland.
Musings in summer 2023: impacts + adaptation
I was talking to some friends today about climate change – in the light of the latest #AMOC paper, suggesting a tipping point. I’m far from an expert on AMOC so if you’re here for that I suggest this comprehensive piece on real climate from Stefan Rahmstorf.
Or the TL;Dr version in thread form compiled by Eleanor Frajka-Williams, PI of OCEAN:ICE sister project EPOC.
Anyway, the conversation turned to what’s going on this summer.

It’s been hot, in short and even if July has been cooler and rainy in Denmark, May and June were hot and record dry..
And it’s fair to say that, as when I’m asked why, or similar questions by journalists, there is an almost overwhelming temptation to say “we told you so”. I think that’s what Antonio Guttieres is getting at here too.
However, that’s not what I was mostly musing on. Given the apocalyptic heatwaves, strange patterns of warming in the ocean and the Antarctic sea ice loss, it feels a little like end of days.
But pretty much all of these were projected pretty accurately by scientists, even if the timing was a bit off and we’re not entirely sure what is driving that extraordinary downturn in Antarctic sea ice (but do read Zack’s piece linked here, it’s very good).
In many ways, we’re fortunate in Denmark and the rest of rich northern Europe. The worst direct impacts, at least in the near and short term, we can probably adapt to, though it will be expensive. They are mostly engineering challenges with a dollop of social science mixed in. And, we should remember that even in wealthy and well-educated Europe, how heavily climate change impacts us is very much determined by our social class.
However, in the long-term (and I do mean really long-term – on the century to millennia scale), we’re facing something more existential. We’re going to lose a lot of Danish land to sea level rise. Exactly how much will largely be determined over the next 20 to 50 years as there’s a pretty clear relationship between greenhouse gases and melting ice.
But we do have time to prepare for it- and most importantly to have some grown up conversations about our priorities as a society. This is going to require a good bit more social and behavioural science. In the medium term, we will need to prepare for ever more storm surges, but adaptation to coastal flooding also falls into the engineering category.
Of course, these local to regional risks still need dealing with and that is largely why my employer has created the awesome Danish climate atlas – to give accurate but also useful climate information to those who need to plan for the future. I suspect an ever greater part of my job will be focused on producing usable projections and climate service information. This is certainly also something we will focus on in the PRECISE project. Being able to make useful sea level rise projections is about more than identifying if an ice sheet is stable* or not, it’s also about how quickly, how likely and how much it is likely to retreat. As we have also focused on at a regional level in the PROTECT project

So that’s ice sheets and sea level. The tl;dr is, we know they’re melting, we still don’t know by how much and how fast they’ll ultimately melt but we still have time to deal with it, at least in wealthy well educated societies like Denmark,.
There is a whole nother discussion to be had about the global south and less equal societies which I don’t feel confident enough to discuss here.
Where I do think we’re more vulnerable in the shorter and medium term is perhaps surprisingly, food production – and that goes for much of Europe too. It turns out that concentrating large amounts of food production in a few key places might be a big mistake. Especially where those places are vulnerable to drought, heatwaves, over extraction of water, not to mention appalling labour conditions, an over-reliance on groundwater, artificial fertilisers and pesticides.
And then there is some evidence that multiple heatwaves could occur concurrently, threatening food production in compound events across several key regions. Perhaps working out how to make the global food chain less vulnerable to disruption at key points should be more of a focus than it is?
And that’s after the latest banditry from Russia, destroying perfectly good foodstocks and the means to distribute them, has given us a clear wake-up call on the interdependence of human society.
(Anders Puck Nielsen a military commentator has an interesting take on that from a strategic point of view here: https://youtu.be/fvPcPZP-6os which is very interesting for Ukraine watchers)
If I were a wise and concerned government I think I’d be thinking about how exactly we’re going to be feeding our population over the next 5-20 years. Where will be able to produce like Spain and Italy today? Or will diets have to change? How do we persuade people to eat more healthily and ensure that food is equitably spread through society?
This is of course also a part of the job of the other working groups, 2 and 3 of the IPCC – and it’s possibly not just an accident or indeed good lobbying that the new IPCC chair, Jim Skea, is a former WG3 coordinator. Perhaps the IPCC also sees that we have now moved into a new world.
So, these are just some of the things I’m thinking about as I prepare to go back to the office after the summer break next week.
As I observed on Mastodon after the IUGG meeting, and online with this excellent heatmap article. Climate science is entering a new phase. It’s the end of the beginning and it’s time to prepare.
*On the subject of ice sheet stability, Jeremy Bassis has an excellent thread on what this does and does not mean over on Mastodon. Worth checking out
Rules of thumb about ice sheets and sea level rise:
One of the advantages of being part of a research institute are the fascinating conversations that happen over lunch between colleagues working in different areas. Today was a classic with conversation ranging from the stratospheric effects of the Hunga-Tonga eruption to the different types of snow crystals that form in snow packs and their impacts on sea ice. However, the conversation started with a request to me for some rules of thumb on sea level rise, so here they are:
The Greenland ice sheet loses on average around 250 to 280 Gigatonnes of ice each year – that’s from all processes including melt and surface runoff, iceberg calving, basal melting and submarine melting.
The Antarctic ice sheet loses on average about 100 Gigatonnes of ice net each year (probably) from all processes, it receives about 2000 to 2500 Gigatonnes of snow (depending a bit on where you measure Antarctica to end) whereas Greenland receives around ~700 gigatonnes of snow.
The small glaciers and ice caps around the world contribute a bit more to sea level rise in total each year than each of the big ice sheets currently, but they will be quickly exhausted. As there are thousands of small glaciers, most of which are not well monitored, we have to estimate how these are changing using models. It appears that on avergae they add around 0.7 to 1 mm of global sea level rise each year.

The thermal expansion of the oceans is still the largest part of currently observed sea level rise but on an annual basis, the cryosphere now often contributes more.
As I’ve elaborated on before, 1 Gigatonne of water is hard to visualise, it is a cube 1 km long, 1 km wide and 1 km high and about 360 Gigatonnes (or km3) raise global average sea level by 1 mm, so Greenland contributes around a half to three quarters of a millimetre to global sea level every year. My old friend Lindsey Nicholson at Innsbruck University has a cool blog (which you should check out here) and shows this visualisation if it helps..

Since the early 1990s sea level rises about 3mm every year, but over the last 5 years it has been closer to 4.5mm per year. The curve over the last 2 decades has followed a quadratic shape rather than a linear shape – put simply, this means sea level is accelerating. The sea rose 10mm from January 2020 to August 2021.

An El Nino, which some are warning could occur this year, may cause a temporary pause or at least slow down in sea level rise, even as global air temperatures increase, mostly due to the large amounts of rain that are associated with it, but this will only be temporary.
While the rate (3-4 mm per year) doesn’t sound like very much, every mm counts, increasing the risk of coastal flooding and storm surges affecting coastal communities.
Finally, global sea level rise is not distributed evenly, broadly speaking, the further away from an ice mass you are, the more likely it is to affect your local sea level, so Greenland matters less than Antarctica in Northern Europe.

I hope these little rules of thumb help. Feel free to add more (or disagree) in the comments..
Changes in SW Greenland ice sheet melt
A paper my colleague Peter Langen wrote together with myself and various other collaborators and colleagues has just come out in the Journal of Climate. I notice that the Climate Lab Book regularly present summaries of their papers so here I try to give a quick overview of ours. The model output used in this run is available now for download.
The climate of Greenland has been changing over the last 20 or so years, especially in the south. In this paper we showed that the amount of melt and liquid water run off from the ice sheet in the south west has increased at the same time as the equilibrium line (roughly analogous to the snow line at the end of summer on the ice sheet) has started to move up the ice sheet. Unlike previous periods when we infer the same thing happened this can be attributed to warmer summers rather than drier winters.

We focused on the area close to Nuuk, the capital of Greenland, as we had access to a rather useful but unusual (in Greenland) dataset gathered by Asiaq the Greenland survey. They have been measuring the run off from a lake near the margin of the ice sheet for some years and made this available to us in order to test the model predictions. This kind of measurement is particularly useful as it integrates melt and run-off from a wider area than the usual point measurements. As our model is run at 5.5 km resolution, one grid cell has to approximate all the properties of a 5.5 km grid cell. Imagine your house and how much land varies in type, shape and use in a 5.5 km square centred on your house and you begin to appreciate the problems of using a single point observation to assess what is essentially an area simulation! This is even more difficult in mountainous areas close to the sea, like the fjords of Norway or err, around south west Greenland (see below).

The HIRHAM5 model is one of very few regional climate models that are run at sufficiently high resolution to start to clearly see the climate influences of mountains, fjords etc in Greenland, which meant we didn’t need to do additional statistical downscaling to see results that matched quite closely the measured discharge from the lake.
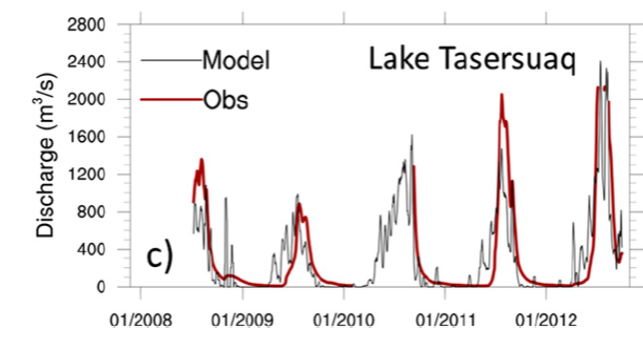
We were pretty happy to see that HIRHAM5 manages to reproduce this record well. There’s tons of other interesting stuff in the paper including a nice comparison of the first decade of the simulation with the last decade of the simulation, showing that the two look quite different with much more melt, and a lower surface mass balance (the amount of snowfall minus the amount of melt and run – off) per year in recent years.

Now, as we work at DMI, we have access to lots of climate records for Greenland. (Actually everyone does, the data is open access and can be downloaded). This means we can compare the measurements in the nearest location, Nuuk, for a bit more than a century. Statistically we can see the last few years have been particularly warm, maybe even warmer than the well known warm spell in the 1920s – 1940s in Greenland.

There is lots more to be said about this paper, we confirm for example the role of increasing incoming solar radiation (largely a consequence of large scale atmospheric flow leading to clearer skies) and we show some nice results which show how the model is able to reproduce observations at the surface, so I urge you to read it (pdf here) but hopefully this summary has given a decent overview of our model simulations and what we can use them for.
I may get to the future projections next time…
Let it snow…
I have found myself shovelling a lot of snow this winter. As with last winter, it has been cold and snowy across northern Europe so far, which has led to the usual questioning of climate change by the usual suspects. There is some very good work examining this on the real climate blog and Marcus Brigstocke did his usual amusing best on the Now Show towards the end of last year, so I’m not going to write about the difference between weather and climate, or about how regional and global average temperatures differ. Rather, the time spent shovelling snow and wandering around the city streets camera in hand to take photos, really brought home how many of the snow processes that are subjects of active research in remote or mountainous areas are currently on display in our cities.
For instance, today in the local park I noticed that there is preferential melt occurring around the trees. The dark tree trunks absorb and emit more radiation that then melts snow around the trees faster than it melts in the open areas of the lawn. This is an important consideration in the planting of forests in snowy areas, since the presence of vast forests can significantly alter the albedo of the earth’s surface, that is how much radiation is reflected back in to space. Planting trees in the tundra to combat climate change may have the unintended effect of actually enhancing warming through changes of this kind.

The process can also be seen to spectacular effect on glaciers, where rocks and boulders shield the ice below them from melting but enhance it around them, leading to the formation of so-called glacier tables, such as this one in Switzerland (from glaciers online).
More seriously, the heavy snow on rooves around the city is currently posing an avalanche hazard rarely encountered outside the mountains. The effect of sunshine on heavy snow, which is resting on a slope of a critical angle, can be extremely dangerous to the unwary. As are the large numbers of icicles which have developed. These are not just a sign of poorly insulated buildings (where the heat leaking out has caused the snow to melt and then quickly refreeze in the low temperatures we’ve had). Icicles falling from buildings show the same mechanics as seracs falling from the steep parts of glaciers known as ice falls. In this case, the ice builds up to such a degree that the sheer weight of it eventually causes fracture when a critical threshold is reached. Pedestrians are learning to walk on the outside of pavements and to look up frequently at the overhanging cornices of snow and ice.
But back to the snow shovelling. I have not done so much digging since fieldwork last winter in Svalbard, where we set up some experiments to study the properties of snow and how this affects the melt, or conversely the growth, of glaciers. Specifically, we were studying the effects of liquid water from snow melt or rain on the snow pack and the glacier surface. Liquid water filters into the snow, or else runs off bare glacier ice if there is no snow and will typically freeze, forming ice lenses in the snow pack, or large areas of what is known as superimposed ice on the glacier surface. As you can imagine, there was a lot of snow shovelling, especially as the high winds on the glacier kept filling in the trenches we dug to work in.
Now this probably sounds like a fairly esoteric set of experiments, but the purpose is actually quite serious, since we need to know how much melt water refreezes to work out how much the glaciers and large ice sheets of the world are melting and how sea level rise is likely to progress in the future in a warming world.
Identifying the melt area of a glacier or ice sheet is a relatively straightforward task using satellite imagery, but identifying how much of that melt runs off or refreezes is impossible at present, so we generally use a model, based on observations and experiments like these, to make an approximation. We also need to factor in the effect of latent heat, (heat that is released when liquid water becomes solid ice) since this can warm up the snow pack significantly. In Greenland for instance, it is likely that the effects of higher temperatures over the last 20 years or so have been buffered somewhat by the snow pack and refreezing processes. However, as temperatures continue to increase, melt will probably accelerate partly because the saturated snow pack cannot absorb additional melt water but also because it has a higher temperature from the release of latent heat and thus requires less additional energy to melt.
Last winter I tested out some of the techniques we used in Svalbard, in a pile of snow in my back garden. I am also aware of at least one study into permafrost, where patterned ground usually found in Arctic climates was created in a back garden in St Andrews, so it’s even possible to do valid experimental work during the winter time when conditions are right. However, the climate of glaciated regions is generally unlike that of the cities of Europe so there will still be a need to go to places like Svalbard to do experiments quantifying these kind of processes. Nevertheless, I still find this kind of weather inspiring and I’m hoping to get more insights as the winter progresses.
