
Currently, I’m very busy getting ready with colleagues to travel to Greenland next week. We have an extremely full programme of fieldwork activities covering oceanography, biology, sea ice, snow and glacier processes as part of our NCKF work. More on these no doubt in a future post…
Yesterday, one of my ace DMI colleagues (without whom most of the work we plan would definitely not happen) shared the first optical satellite image of the area this year – taken by ESA’s Sentinel 2 (a truly astonishing source of free imagery and everone should know about it). Because the area is very far north, it has been in the Polar night until now so we have been reliant on the ESA Sentinel 1 imagery based on radar.

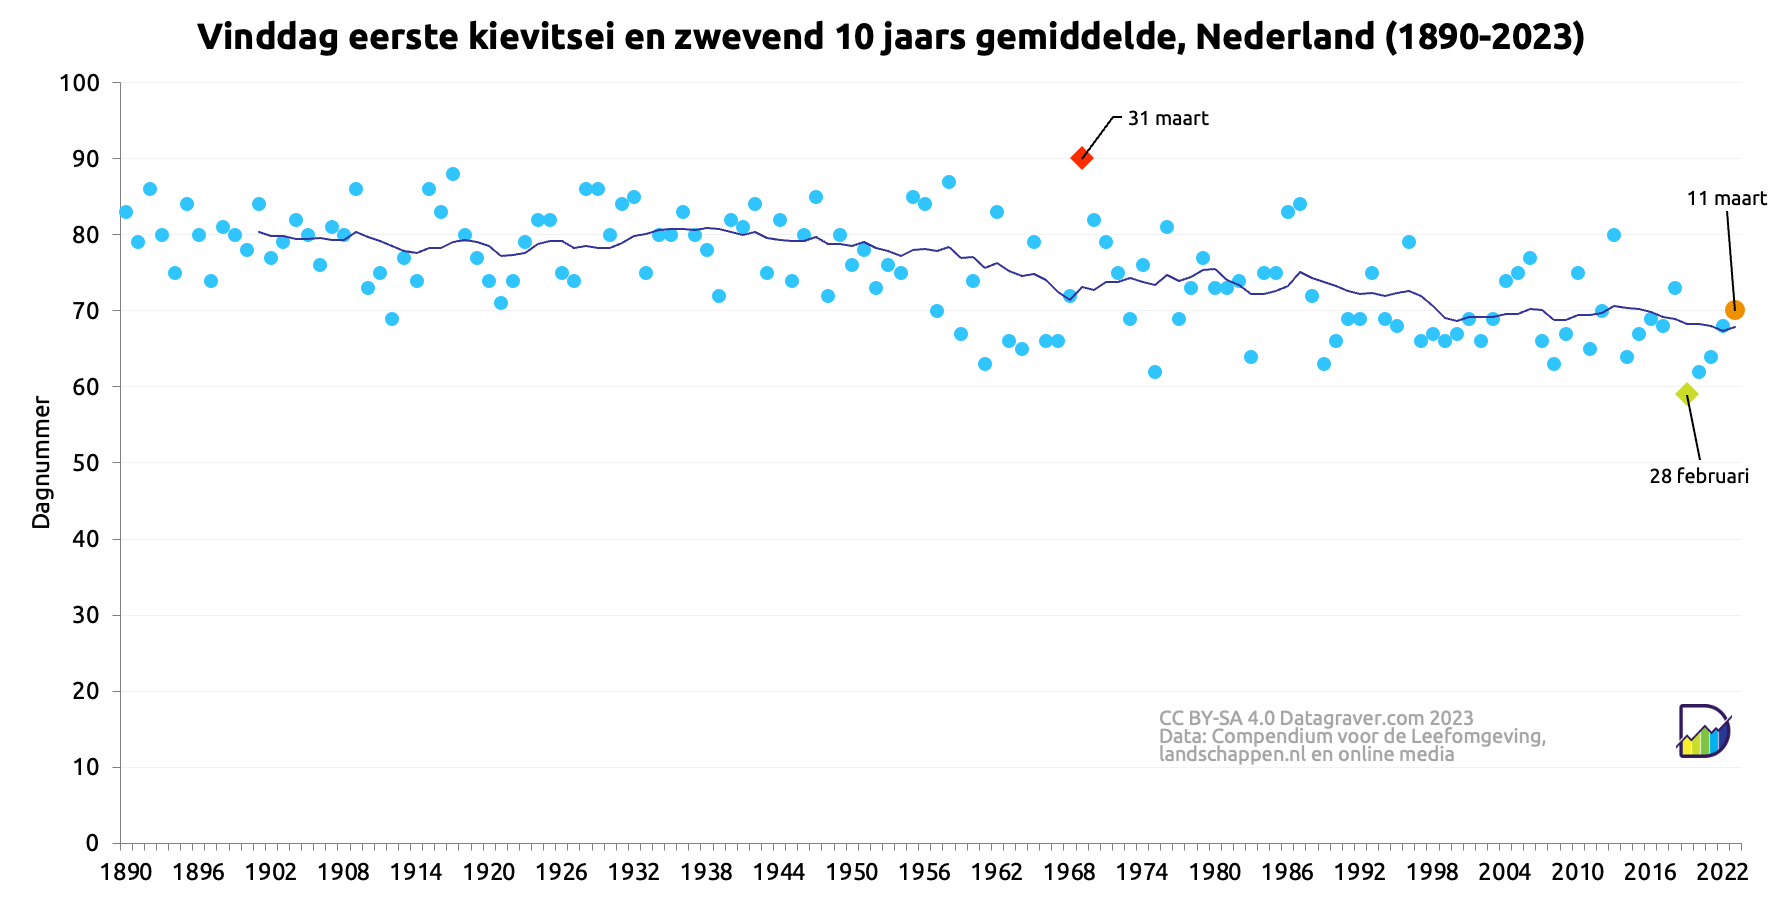
It’s a wonderful thing to see the first satellite image of Spring, akin to other signs like the first cuckoo (in the UK), the first peewit egg (in the Netherlands), and the timing of the cherry blossom in Kyoto.
There was recently a very illuminating thread on phenology on mastodon in reply to a query by Pauline von Hellerman where the Diagram Monkey John Kennedy pointed out the existence of the Pan European Phenology network – not something I was aware of before (though I’d suspected it’s existence) – and who have all sorts of interesting data.
Where biology is clearly showing us earlier springs due to climate change, the date of the first optical image is unlikely to change any time soon due to climate change.

Nor are species assemblages (it’s not quite certain that it’s the same variety of cherry blossom for the whole 1200 year period), or biodiversity losses (the cuckoo is down 65% since the early 1980s alone in the UK, and heaven knows it was not particularly common then) likely to affect it. Not to mention human behaviour changes, the lapwing has gone from being a common agricultural bird to near threatened over the same period, which probably also affects the reliability of that data.

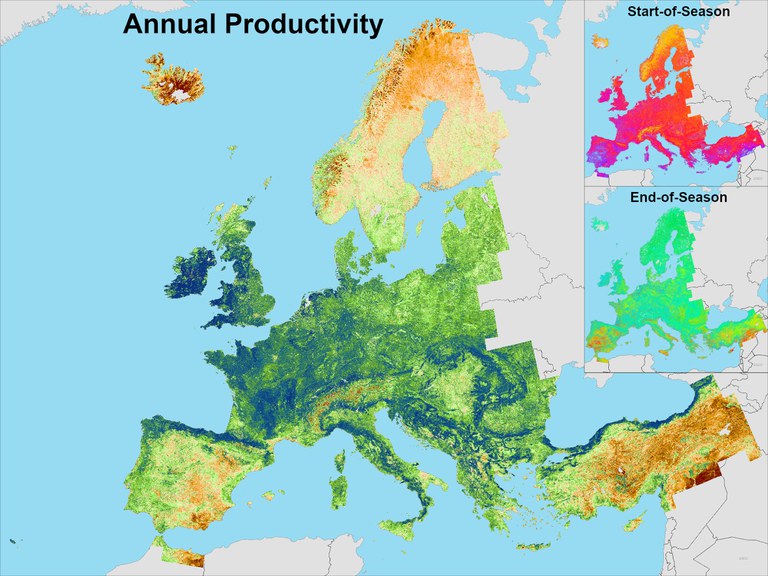
Of course, quite a bit of what you might call bulk phenology can be done by satellite too now…
As for Qaanaaq, there is not much in the way of biological phenology, but a compilation and analysis of data on sea ice cover and thickness over the last 60 years would probably be as instructive. Do get in touch if you’re interested in doing this as a student project…
