
A paper appeared in Science this week about sea level rise in the last interglacial (about 129-116,000 years ago). It has sparked the usual predictable headlines as it points out that during that period, sea level rose by about 6-9 metres but that that the ocean temperature as far as it can be reconstructed, is about what we see now, that is about 0.5C warmer than the preindustrial.

In a sense this isn’t that “new” – we’ve known about higher sea levels during the last interglacial for ages and that the global mean temperature was roughly 2C above the pre-industrial global mean. This is in fact one of the reasons for the Paris target (though some scientists speculate that it’s also pretty much already out of reach).
However, the sea surface temperature stuff makes it extra interesting as the ocean is a pretty big source of uncertainty in global climate models and mot models do not manage to reproduce modern day ocean temperatures all that well.
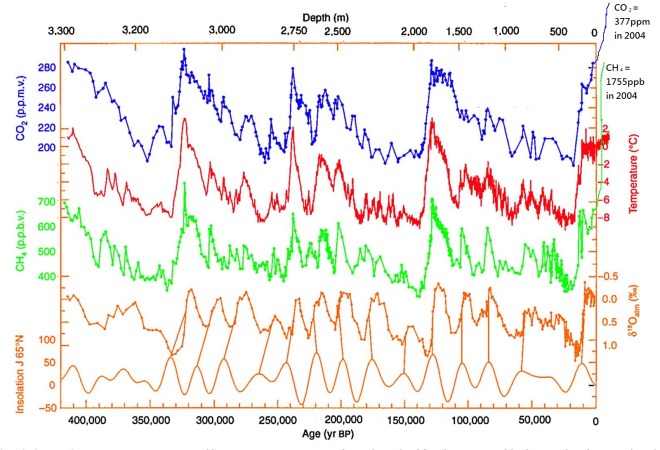
It should also be said that the last interglacial is only a good analogue for 2C world up to a point – it was warm because of enhanced solar input, not because of greenhouse gases as this plot from an Antarctic ice core, edited by the awesome Bethan Davies at the Antarctic Glaciers blog shows:
It’s also interesting to speculate where the water came from – the Greenland ice sheet was much smaller than today but it was still there and now “only” contains 7m of sea level rise today. So the complete disappearance of Greenland cannot explain the rise in global sea level. The small glaciers and ice caps of the world can’t contribute more than half a metre or so either. Therefore it has to be Antarctica contributing the most – East or West is the question and it really is a very very longstanding question.
The progress in the international polar year (IPY) in mapping the bedrock of Antarctic in the BEDMAP2 brought quite a few surprises, including the discovery of several very deep marine basins in the East that could potentially contribute a lot of water to sea level.
More recently, channels under the floating ice shelves of west Antartica, along with various modelling studies have proposed that the west could be much more unstable than thought. Actually this has been a very very longstanding problem in Antarctic science since at least the late 1970s when John Mercer first proposed the marine ice sheet instability hypothesis.
In any case, events in both Denmark and the UK have brought this problem home more sharply.
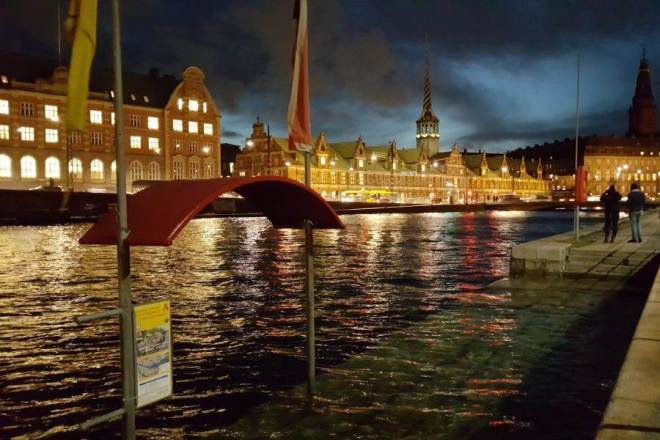

The “silent storm surge” in January 2017 around the coast of Denmark was a hundred year event in many places, but as Aslak Grinsted points out, sea level rise makes a hundred year event a 20 year event with only a small rise.
Sea level will not rise equally everywhere, the fingerprint of Greenland ice sheet loss is felt largely in the Pacific, Antarctic ice melt will be felt in Europe. It matters where the water comes from. A point not generally appreciated.
So this new paper is also important, but it only underlines that we need to be able to make much much better estimates of how fast and how far the ice sheets will retreat, which is the justification for much of my own scientific research.
Finally, I think it’s probably necessary to point out that sea level is already rising. This was asked by a listener to Inside science, one of my favourite BBC radio 4 programmes/podcasts. I was a little surprised that an apparently scientifically literate and interested member of the public was not aware that we can measure sea level rise pretty well – in fact to an extent, the global warming signal is more easily detected in the ocean than in the global temperature record. This is because the ocean expands as it warms and there is ocean pretty much everywhere, whereas temperature observations are patchy and mostly on land. Clearly, scientists like myself are *still* not doing a very good job of communicating our science more widely. So here is the global mean sea level record to date, it’s updated pretty regularly here and on average, sea level is rising at about 3mm per year or 3cm per decade.

When we look at tidal gauges,sea level rose about 20cm in the 2oth century

The big uncertainties we have on whether or not this will accelerate in years to come is largely down to missing processes in ice sheet models that we don’t yet understand or model well – mostly calving by glaciers and ice shelves. I promised Steve Bloom a blog post on that at some point – I have a paper to finish and new simulations to run, but hopefully I’ll get round to that next.
UPDATE: I was made aware this morning of a new report from the European Environment Agency about climate change impacts and adaptation in Europe. In the report they state (correctly) that while the IPCC 5th Assessment Report suggested that in the 21st century the likely sea level rise will be on the order of half a metre, some national and expert assessments (I took part in a couple of these) had suggested an upper bound of 1.5 – 2m this century, for high emissions scenarios.
This is a big difference and would be pretty challenging to adapt to in low-lying countries like the Netherlands and Denmark, not to mention big coastal cities like London or Hamburg. It’s laso important to emphasise that it doesn’t jsut stop at the end of the century, in fact our simulations of the retreat of Greenland ice sheet suggest it’s only just getting going at the end of this century and the next century the rate of ice loss will really start to accelerate.
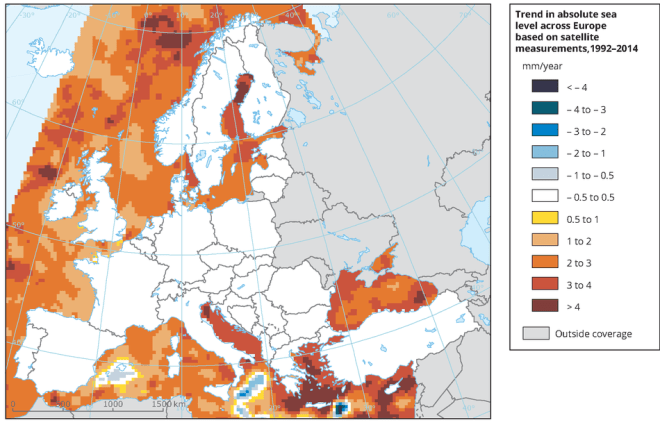
All of which is to say, there’s really a very good reason to act now to reduce our emissions. The EEA has also produced this very nice map of observed sea level rise in Europe over the last two decades based on Copernicus environmental data.
With the prospect of American federal funding for environmental observations being reduced or strongly constrained in the future, it’s really important we start to identify and support the European datasets which are the only other sources of environmental monitoring out there right now.

Thanks for the nice post.
However, the sea surface temperature stuff makes it extra interesting as the ocean is a pretty big source of uncertainty in global climate models and most models do not manage to reproduce modern day ocean temperatures all that well.
Interesting. What are you thinking of? Any references?
LikeLike