
This is a lightly edited and expanded post in response to a Reuters fact checking query. I gather one of the usual suspects (in the place formerly known as the birdsite) has been spreading misinformation and confusion about the magestic Petermann Glacier in Northern Greenland. So here’s a few thoughts. The TL;DR is in the title, but if you want to know why it’s not growing, how we know it’s not growing and what it means, read on…
Petermann Glacier is a truly awesome outlet glacier of the Greenland ice sheet. It drains about 4% of the ice sheet and sadly I’ve only seen it in satellite photos as it’s rarely visited, for all the good reasons you can imagine (expense, remoteness, sea ice, terrible weather…). But the photos show a floating ice shelf, sometimes called an ice tongue, enclosed in a narrow fjord with steep cliffs. Underneath Petermann glacier a canyon, similar to but much bigger than the Grand Canyon, carved by ancient rivers pre-glaciation snakes all the way to the centre of the Greenland ice sheet.
But, that’s not why it is a glacier of choice for a section of the climate (denier) community. It behaves very much like any ice shelf; that is, it calves a large iceberg, but as the glacier is still flowing from areas of accumulation to areas where melt and calving balance it, so the front continues moving forward to roughly it’s previous position, before calving another large iceberg. This is a well understood cylce but it also means that if you cherry pick your starting and ending dates you can indeed show that the front is “advancing”. However, this is not the same as the glacier “growing”. Let’s take a look.
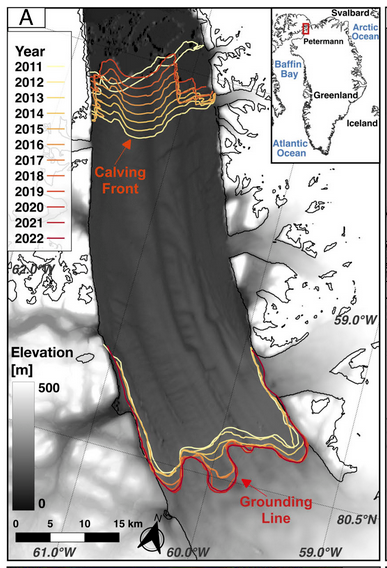
It is one of the only remaining ice shelves in Greenland – all of the others have collapsed and not regrown and there is good reason to suspect Petermann is also on the same trajectory. I had a student a few years ago who showed the ice shelf itself is thinning, and that it was unlikely to remain stable for long. We never managed to publish it, though a publication from Eric Rignot’s group that came out earlier this year largely shows the same things we found. The cycle of calving and advance is quite clear in their Figure 1a, as is the retreat of the grounding line – the point at which the glacier starts to float. This is significant because as the glacier gets thinner, the grounding line will likely retreat inland.
So does NASA Worldview imagery show that Petermann glacier has been growing at roughly 3 metres per day for the past 11 years? (As intimated by a number of accounts on the internet.)
No it does not.
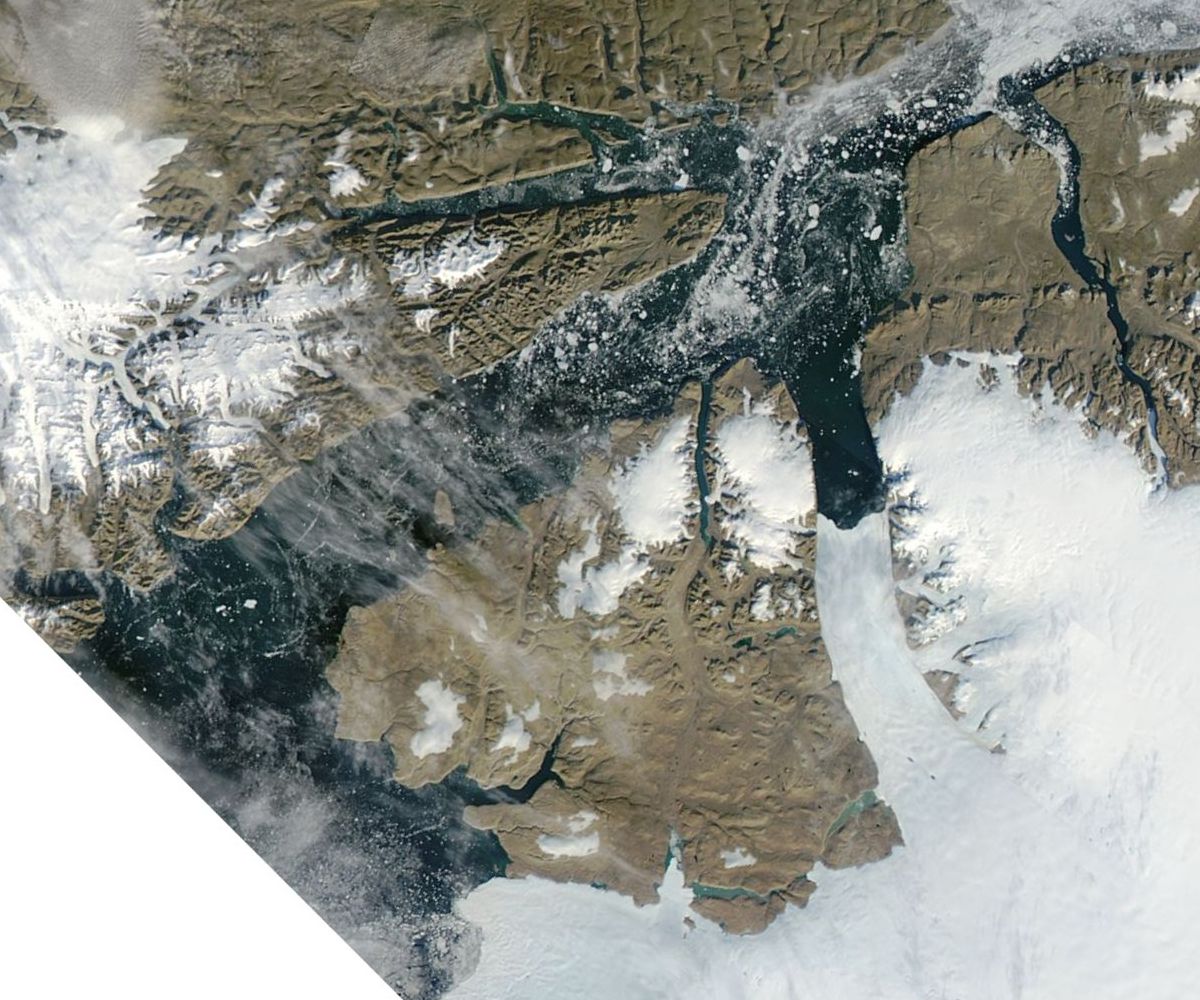
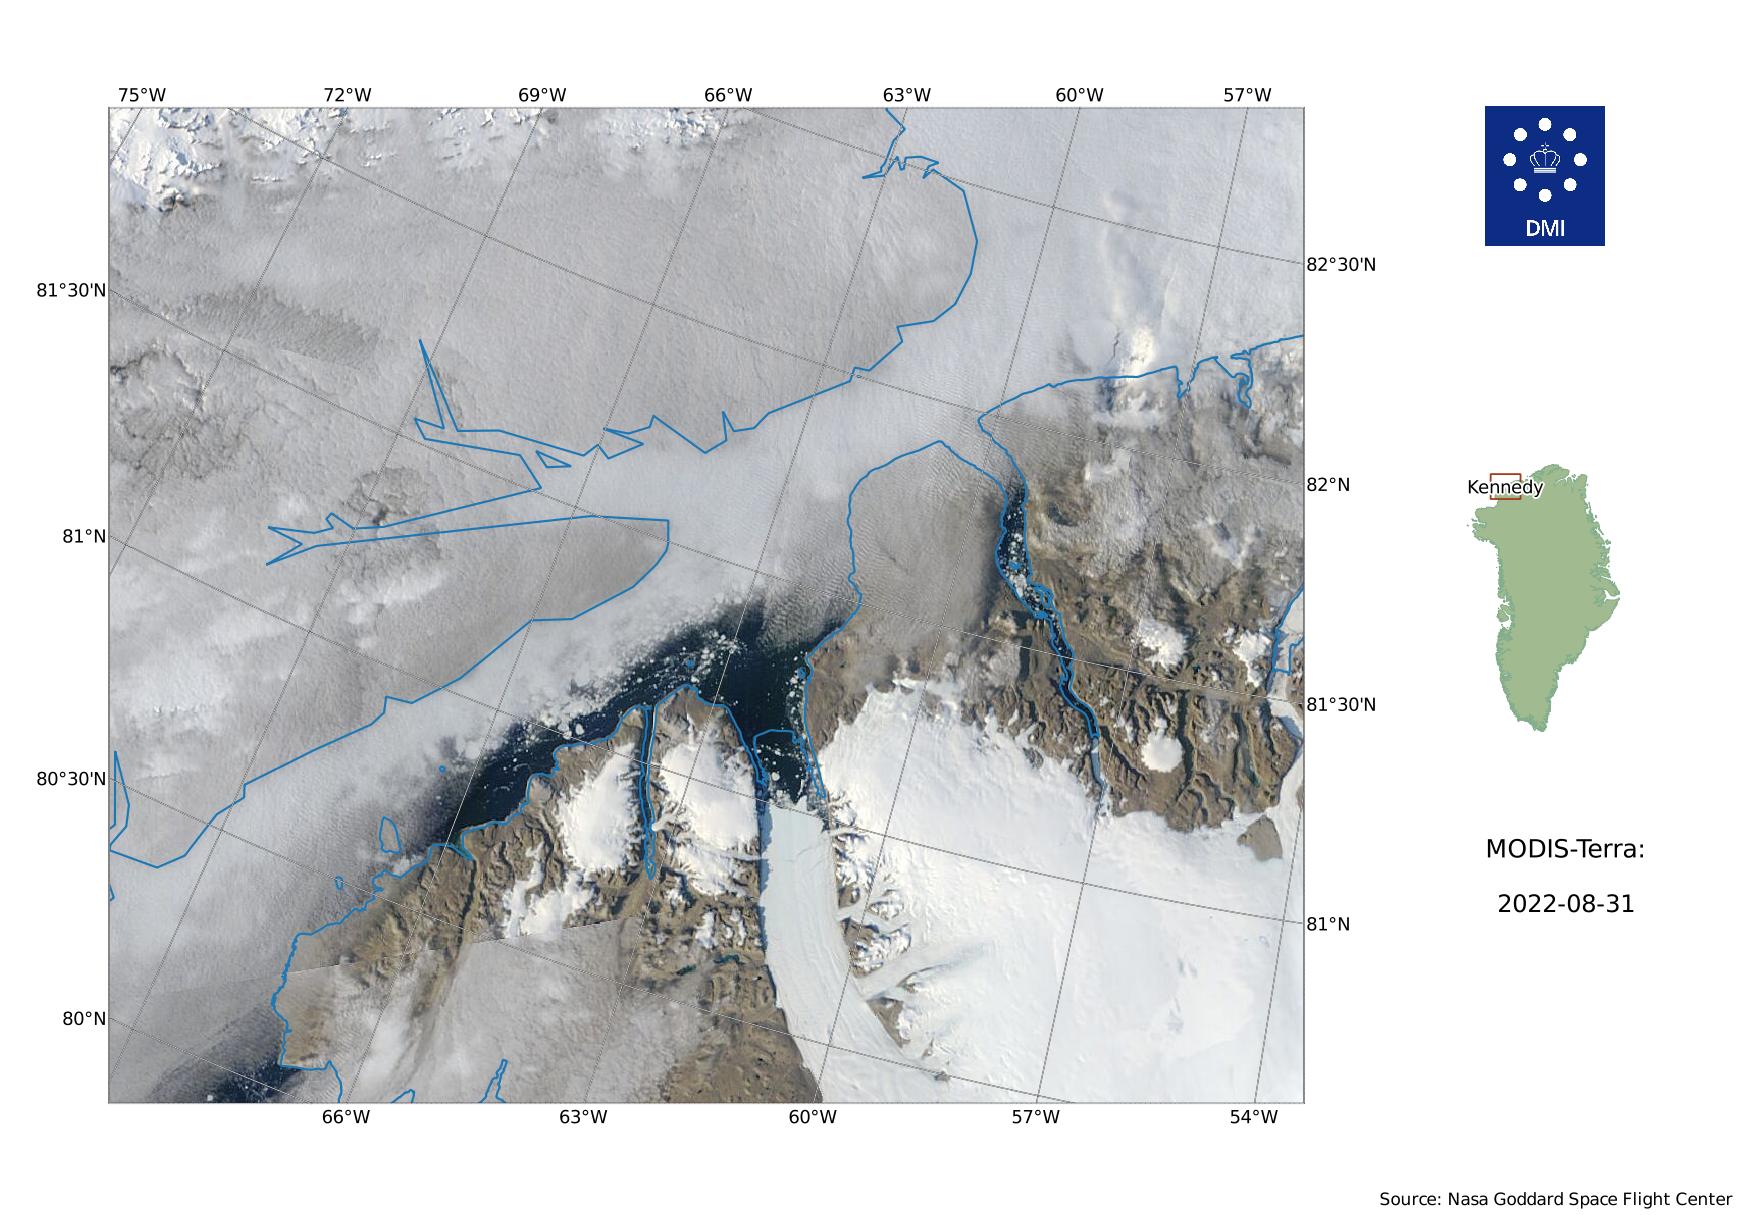
You can play a semantic trick here though. Satellite imagery shows that the front of the glacier has been moving forward for the past 11 years (note that it doesn’t move much in winter, it’s mostly a summer feature after the sea ice has broken up). Compare these two images which I grabbed from DMI’s satellite picture archive around the coast of Greenland, in it the glacier terminus does appear to be ahead in 2022 compared to 2012.
But the choice of 2012 is a trick as a large calving event occurred on the 16th July 2012, after a previous large one in 2010, so the glacier was more or less at it’s minimum in recent years if you choose 2012 as a starting position.

This is of course the difference between noise and signal and a similar trick to choosing to start your temperature curve in 2016 for example, right after a big El Nino event.
After the glacier calves a large iceberg the glacier behind continues to push ice out through the channel. The ice still flows and the front eventually moves back to roughly the same position it was in before the calving. However that does not mean the glacier is “growing”.
A glacier only grows if it gains more glacier ice each year than it loses.
Glaciers lose ice in 3 ways: they melt at the surface and this runs off the glacier; they can calve icebergs off – at a glacier like Petermann, this may only happen every few years; or, they can be melted from underneath by warm ocean water.
If these three mass budget terms added together are bigger than the amount of snow falling each year then the glacier will shrink. If more snow falls than is lost by these three processes, then the glacier is growing.
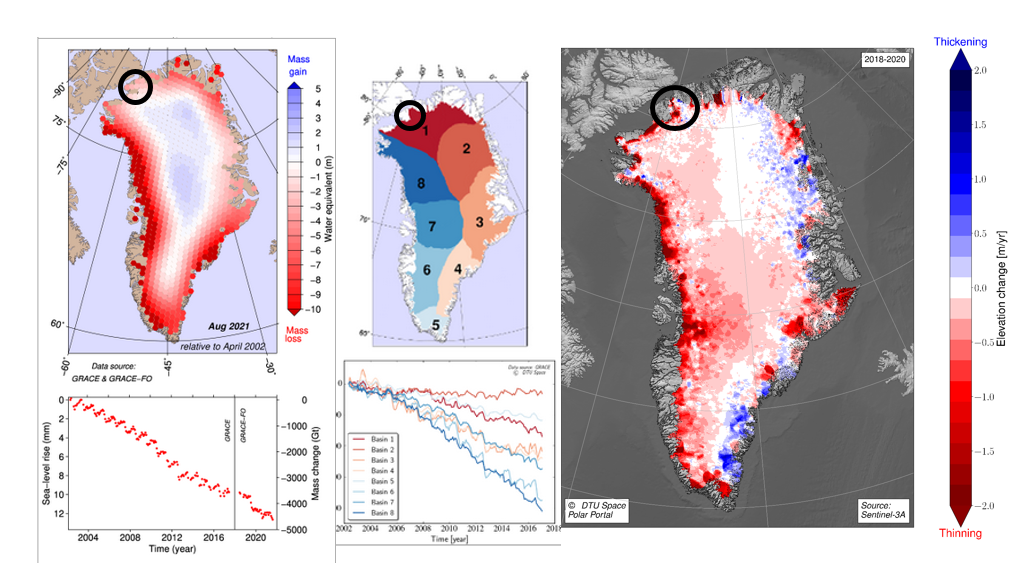
At Petermann glacier all three ways to lose ice are happening. We have seen the calving, the surface melt and runoff is clearly visible in the satellite image below and the thinning of the glacier (ocean melt as well as stretching as the ice flows) has been measured by satellites and radar measurements.

Adding up all the ways glaciers lose ice, together with the amount of snow that falls each day or each year gives a new mass budget. We do this for the whole of the Greenland ice sheet on the polar portal in near real-time.
We can therefore check how much this net ice change budget is by using GRACE satellite data. GRACE measures change in mass by gravimetry and the data, processed by DTU Space colleagues, is displayed on our polar portal website here: http://polarportal.dk/en/greenland/mass-and-height-change/
And it shows that this region of Greenland has lost ice every single year since 2002 when the satellite was launched.
This is not a surprise, a paper by Jeremie Mouginet et al. all the way back in 2019 estimated that Petermann glacier alone had lost 56 Gt of ice for the period 1972 to 2017. Most of this ice has been lost since the late 1990s. Their estimate agrees well with results presented in Mankoff et al., 2021, who update their dataset each week and show that there is pretty steady net ice loss from Petermann from both calving and surface melt that continues to the present day.
So the Petermann Glacier is not growing, even if the front is advancing. But the satellite pictures of the glacier do tell us something about the local conditions of the glacier. Petermann glacier is in a long narrow fjord in a region where there is a lot of sea ice. This is probably why the ice shelf has survived so long when many other similar ice shelves have collapsed and disappeared over the last 30 years or so. 50 years ago there were a lot more ice shelves in Greenland and across the whole of the Arctic. Most of them have now gone.
The figure below (from Hill et al., 2018 https://tc.copernicus.org/articles/12/3243/2018/ ) shows all the places where there used to be floating ice tongues, only Petermann, Ryder glacier (which is significantly shorter now than it was in the 1990s) and 79 North remain in Northern Greenland with some floating bits of Storstrømmen also technically still counting as shelves in the east.

Given the thinning that has been recorded at the Petermann Shelf, it’s probably only a matter of time before this magestic glacier also loses its shelf. And there are two ways that might go. It might follow the path of Sermeq Kujalleq, previously known as Jakobshavn Isbræ. The fairly dramatic collapse of which over a few months in 2002 was a massive wake-up call to the glaciology community that things can change very fast indeed and they may not be reversible.


Or it may retreat in a more low-key way, like the relatively nearby glacier C.H. Ostenfeld where the ice shelf indeed was more ice tongue like* and slowly fragmented and washed out the fjord over several years.


It’s not very easy to say which path Petermann will take, it may even take a hybrid between the two, with first slow disintegration like Ostenfeld, with a more rapid collapse like Sermeq Kujalleq as the grounding line approaches.
Time will, unfortunately, almost certainly tell.
And now back to the day job..
*An ice shelf and an ice tongue are similar but not quite the same, I would call Petermann an ice shelf whereas C H Ostenfeld was rather tongue like by the time it collapsed, though the others in nrthern Greenland are and were definitely more shelf like. See for example this spectacular image of the Erebus ice tongue in Antarctica. Glacier tongues still exist in Antarctica but with the loss of Ostenfeld, they are now non-existent in Greenland.


Thank you for clarifying that the glacier is indeed growing.
I ignore the ridiculous tricks to deny it.
LikeLike
They who can read are clearly at an advantage… The glacier is NOT growing, the ice tongue (OVER the glacier) is. You seem confused, so here’s the definition of a glacier to help you out:
https://en.m.wikipedia.org/wiki/Glacier
Why post Anonymous if you are not prepared to discuss the matter?
LikeLike