The first piece gives an overview of the Foundation itself. Among other nuggets, I learnt they own 77% of shares in Novo Nordisk, which effectively insulates the pharmaceutical company from hostile takeovers.
The second is a piece on the FT Person of the Year: Lars Fruergaard Jørgensen, their CEO.
I’m sharing then both here but each link can only be opened 3 times. If and when I work out the internet archive, I will see if I can update them.
As a TL;DR, and for those not really into this kind of thing, Novo Nordisk have long been large suppliers of insulin for diabetes patients. However, some canny investment and a lot of hard work has resulted in the development of 2 similar drugs, Ozempic and Wegovy, that not only fight diabetes but also lead to significant weight loss, with associated health benefits like reductions in heart attacks. These are, to some extent the modern equivalent of the philosopher’s stone and Novo Nordisk is now, by market capitalisation at least, Europe’s most valuable company…
The huge size of Novo Nordisk could be a problem for Denmark – our Nokia moment perhaps. And the outsize influence the foundation has on science in Denmark has not gone unnoticed either.
On the whole though, I think it’s a positive, especially as the areas they will fund are also under expansion.
Using a commercial company to fund a foundation has a pretty long tradition here in Denmark with most of our biggest companies including Carlsberg, Rockwool, Mærsk and Velux all funding research (and probably other companies too).
So, that’s a quick link to some of the reading I’ve been catching up on over the Christmas and new year’s break. I hope you’re all having a nice break (for those of you on holiday), too!
Another very high quality blogpost from John Kennedy with his usual mix of insight and wit.
This one struck me as especially interesting as I’m also starting to investigate deep learning for regional climate and surface mass balance models. Lots of bear traps for the unwary clearly, but also genuine promise.
Read on and of course, follow!
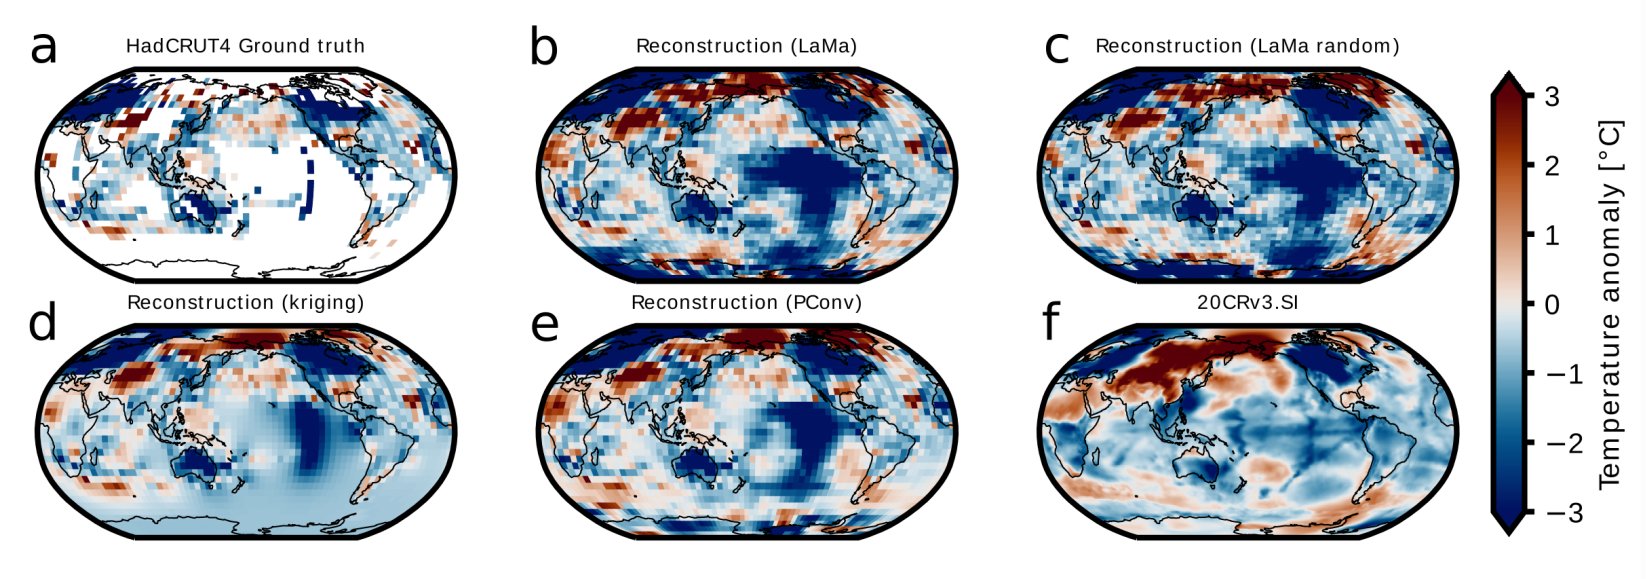
A preprint has appeared on infilling of global temperature data using “deep learning”. On their tests, it performs better than the Kadow et al. method. That’s quite interesting and new methods for filling the gaps in HadCRUT are always great to see. What’s more exciting, potentially, is that they used the same method to infill […]
UPDATE THE MORNING AFTER (21/10/2023): water levels are now falling rapidly to normal and the worst of the gales are past, so it’s time for the clean-up and to take stock of what worked and where it went wrong. It’s quite clear that we had a hundred year storm flood event in many regions, though the official body that determines this has not yet announced it. Their judgement is important as it will trigger emergency financial help with the cost of the clean-up.
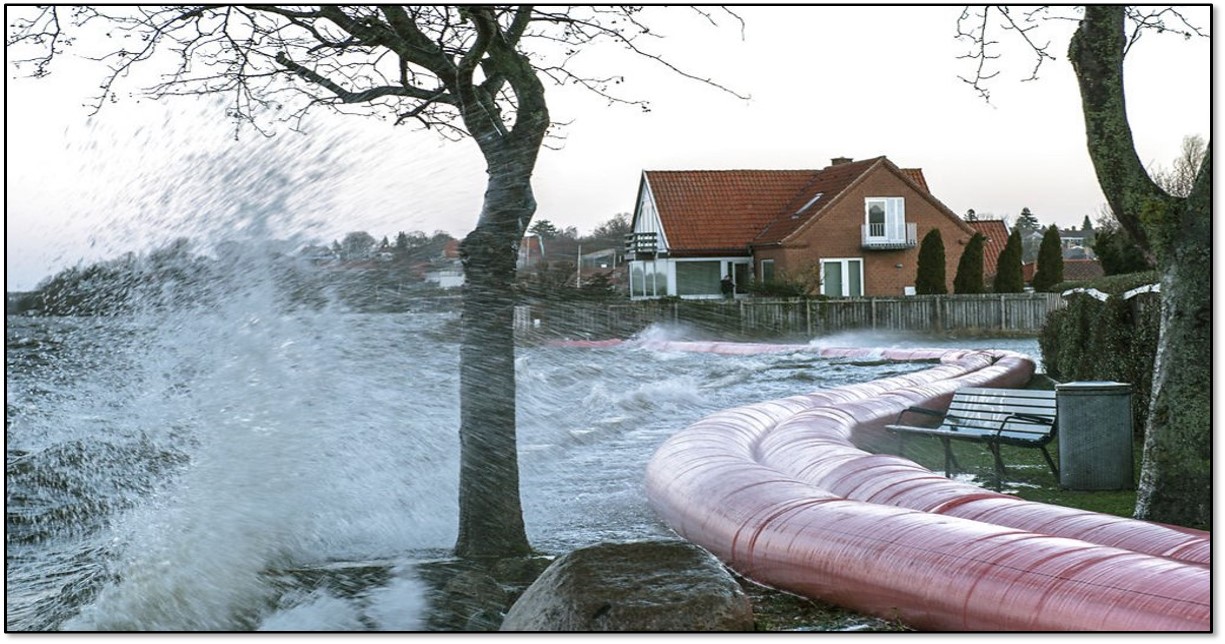
In most places the dikes, sandbags and barriers mostly worked to keep water out, but in a few places they could not deal with the water and temporary dikes (filled pvc tubes of water km long in some cases) actually burst under the pressure, emergency sluice gates and pumps could also not withstand the pressure in one or two places.
Trains and ferries were delayed or cancelled and a large ship broke free from the quayside at Frederikshavn and is still to be shepherded back into place.
Public broadcaster DR has a good overview of the worst affected places here.
Water levels reached well over 2m in multiple places around the Danish coast and in some places, water measurements actually failed during the storm..
In other places, measurements show clearly that the waters are pretty rapidly declining. So. A foretaste of the future perhaps? We will expect to see more of these “100 year flood” events happening, not because we will have more storms necessarily but because of the background sea level rising. It has already risen 20cm since 1900, 10cm of that was since 1991, the last few years global mean sea level has risen around 4 – 4.5 mm per year. The smart thing to do is to learn from this flood to prepare better for the next one.
But we as a society also to assess how we handle it when a “hundred year” flood happens every other year…
-Fin-
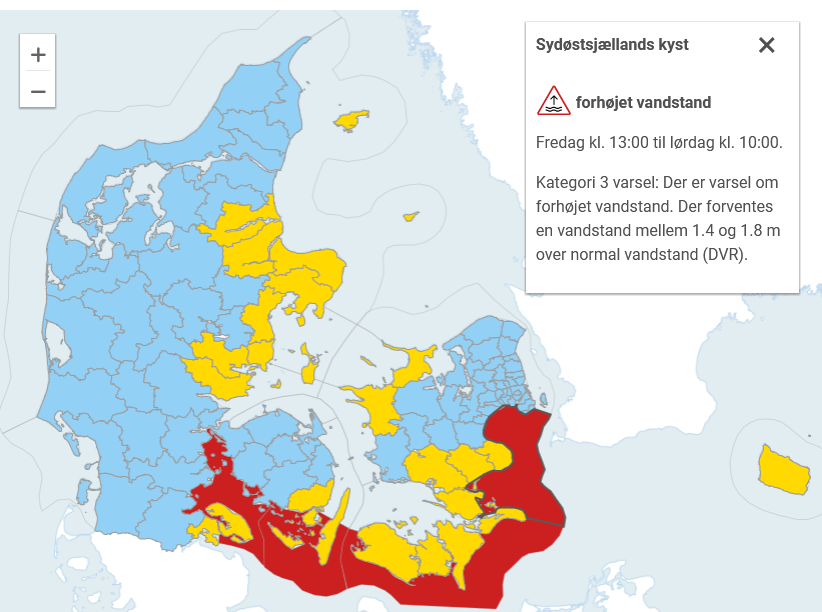
Like much of northern Europe we have been battening down the hatches, almost literally, against storm Babet in Denmark this week. DMI have issued a rare red weather warning for southern Denmark, including the area I often go kayaking in.
Weather warning issued by DMI 20th October 2023 There are three levels, blue signifies the lowest, yellow is medium and the highest is red, which is rather rarely issued. The boxed text applies to the red zome around southern Denmark and states it relates to a water level of between 1.4 and 1.8m above the usual.
I should probably start by saying that this storm is not caused by climate change, though of course in a warming atmosphere, it is likely to have been intensified by it, and the higher the sea level rises on average, the more destructive a storm surge becomes, and the more frequent the return period!
Neither are storm surges unknown in Denmark -there is a whole interesting history to be written there, not least because the great storm of 1872 brought a huge storm surge to eastern Denmark and probably led directly to the founding of my employer, the Danish Meterological Institute. My brilliant DMI colleague Martin Stendel persuasively argues that the current storm surge event is very similar to the 1872 event in fact, suggesting that maybe we have learnt something in the last 150 years…
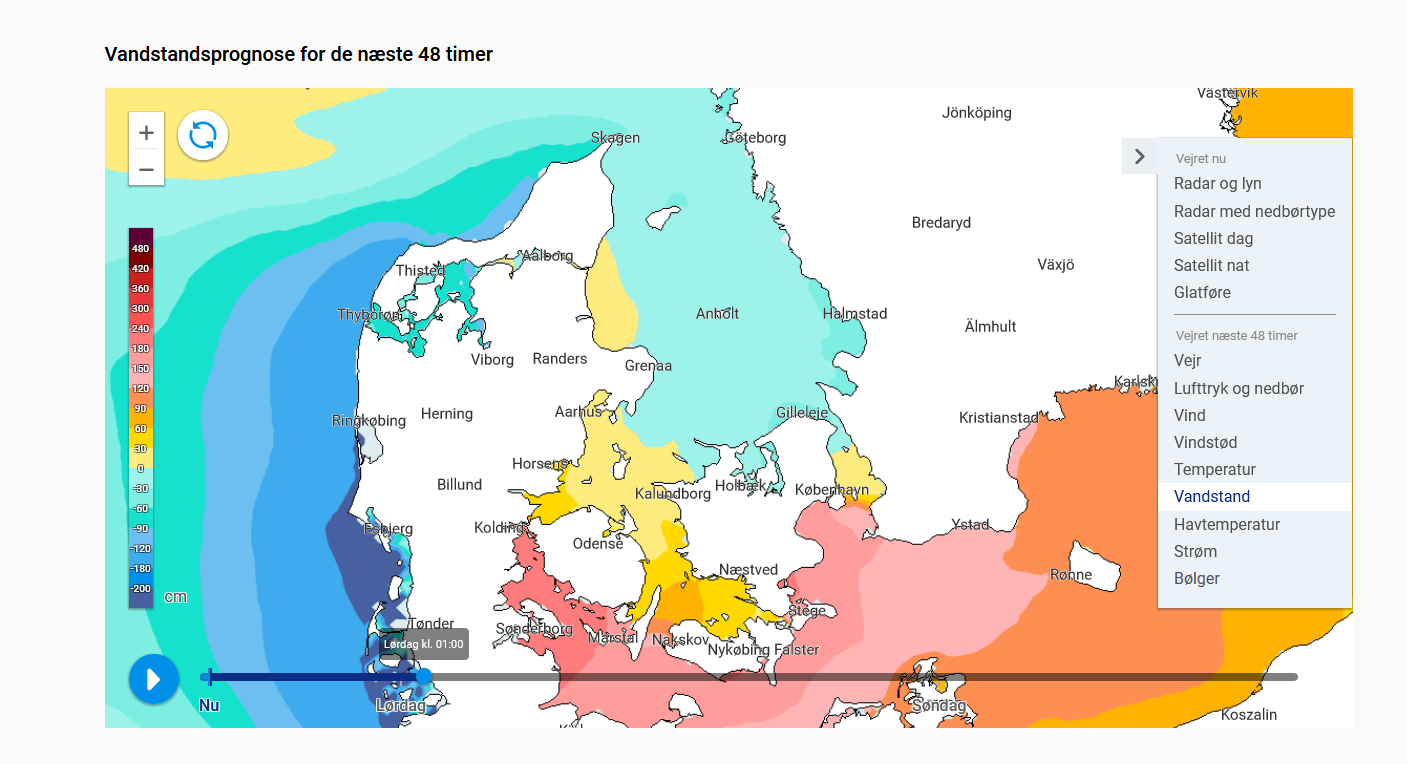
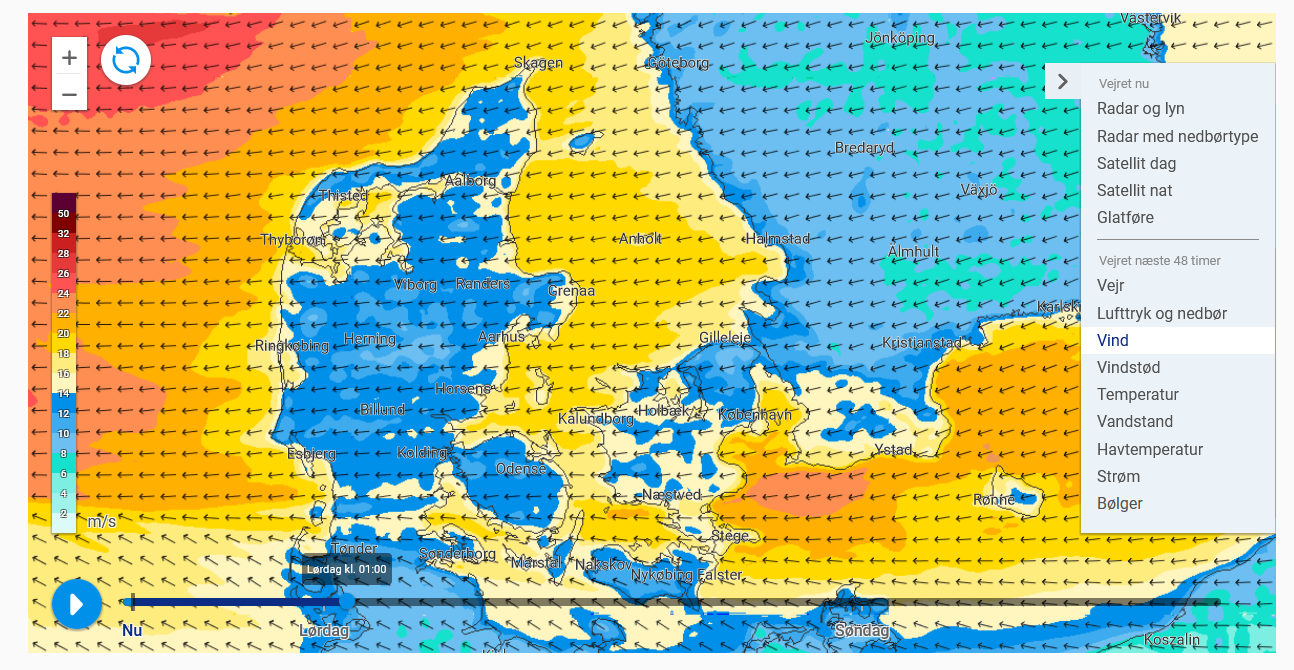
However, back to today: the peak water is expected tonight, and the reason why storm surges affect southern and eastern Denmark differently to western Denmark is pretty clear in the prognosis shown below for water height (top produced by my brilliant colleagues in the storm surge forecasting section naturally) and winds (bottom, produced by my other brilliant colleagues in numerical weather prediction):
Basically, the strong westerly winds associated with the storm pushed a large amount of water from the North Sea through the Kattegat and past the Danish islands into the Baltic Sea over the last few days. Imagine the Baltic is a bath tub, if you push the water one way it will then flow back again when you stop pushing. Which is exactly what it is now doing, but now, it is also pushed by strong winds from the east as shown in the forecast shown above. These water is being driven even higher against the coasts of the southern and eastern danish islands.
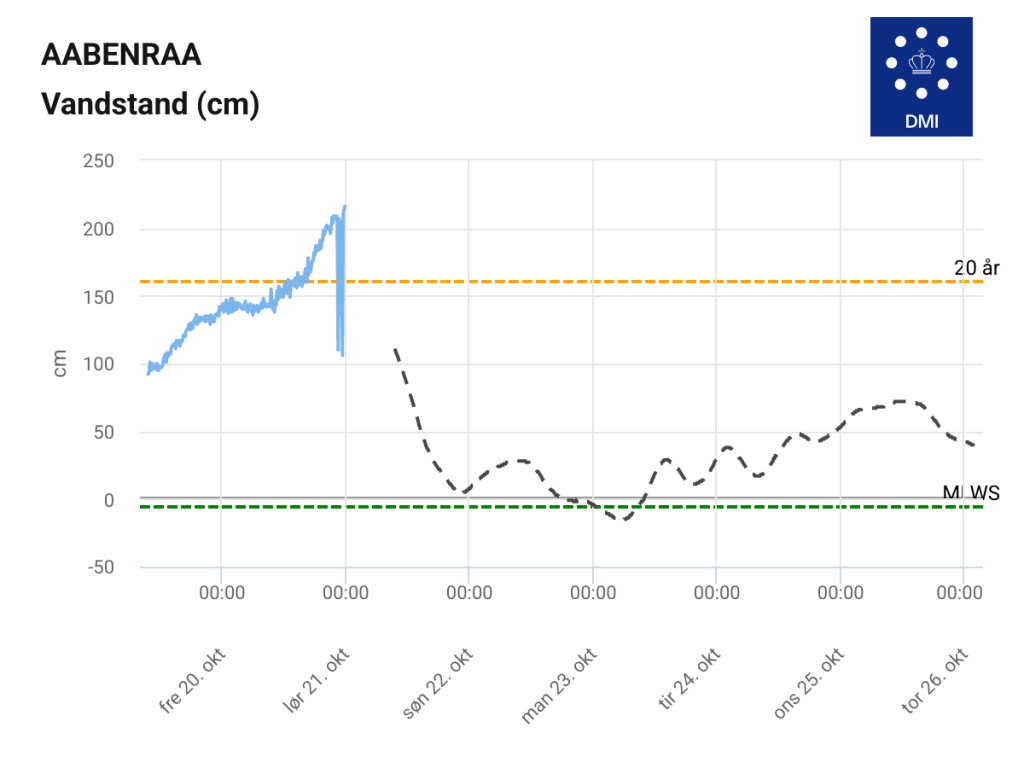
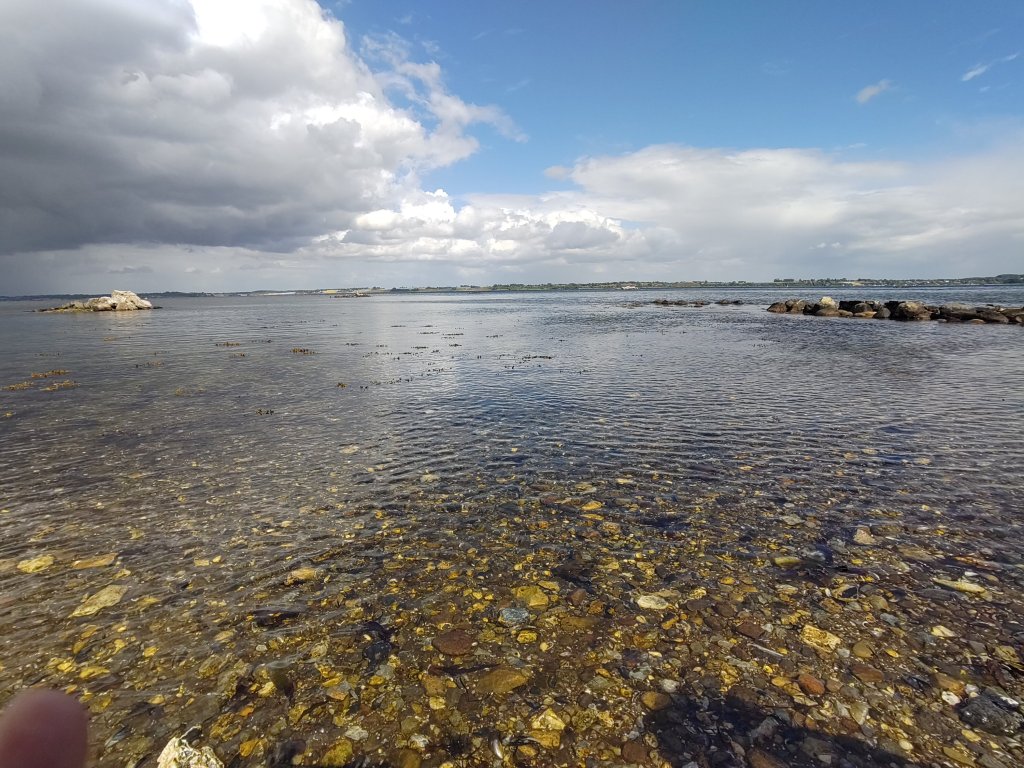
These kind of storm surges are sometimes known as silent storm surges by my colleagues in the forecasting department because they often occur after the full fury of the storm has passed. I wrote about one tangentially in 2017. This time, adding to the chaos, are those gale force easterly winds, forecast to be 20 – 23 m/s, or gale force 9 on the Beaufort Scale if you prefer old money, which will certainly bring big waves that are even more problematic to deal with that a slowly rising sea, AND torrential rain. So while the charts on dmi.dk which allow us to follow the rising seas (see below for a screengrab of a tide gauge in an area I know fairly well from the sea side), water companies, coastal defences and municipalities also need to prepare for large amounts of rain, that rivers and streams will struggle to evacuate.
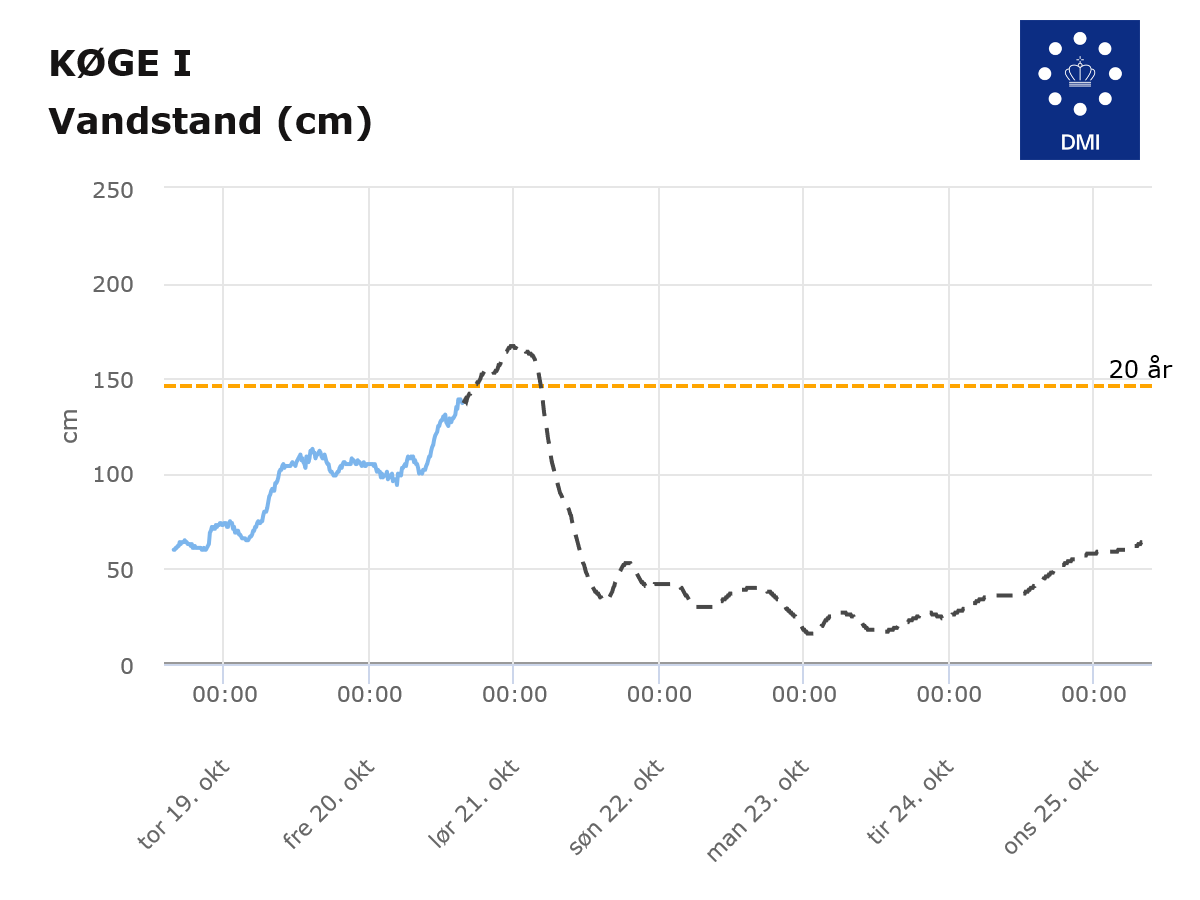
Water height forecast for Køge a town in Eastern Sjælland not far from Copenhagen. The yellow line indicates the 20 year return period for this height. Blue line shows measurements and dashed black lines show the forecast from the DMI ocean model. You can find more observations here.
In Køge the local utilities company is asking people to avoid running washing machines, dishwashers and to avoid flushing toilets over night where possible to avoid overwhelming sewage works when the storm and the rain is at the maximum.
This brings me to the main lessons that I think we can learn from this weather (perhaps super-charged by climate) event.
Firstly, it’s the value of preparedness, and learning from past events. There will certainly be damage from this event, thanks to previous events, we have a system of dykes and other defence measures in place to minimse that damage and we know where the biggest impacts are likely to be.
Secondly, the miracle, or quiet revolution if you will, of weather and storm forecasting means we can prepare for these events days before they happen, allowing the deployment of temporary barrages, evacuations and the stopping of electricity and other services before they become a problem.
This is even more important for the 3rd lesson, that weather emergencies rarely happen alone – it’s the compound nature of these events that makes them challenging – not just rising seas but also winds and heavy rain. And local conditions matter – water levels in western Denmark are frequently higher, the region is much more tidally influenced than the eastern Danish waters. This is basically another way of saying that risk is about hazard and vulnerability.
Finally, there are the behavioural measures that mean people can mitigate the worst impacts by changing how they behave when disaster strikes. Of course, this stuff doesn’t happen by itself. It requires the slightly dull but worthy services to be in place, for different agencies to communicate with each other and for a bit of financial head room so far-sighted agencies can invest in measures “just in case”. We are fortunate indeed that municipalities have a legal obligation to prepare for climate change and that local utilities are mostly locally owned on a cooporative like basis – rather than having to be profit-making enterprises for large shareholders..
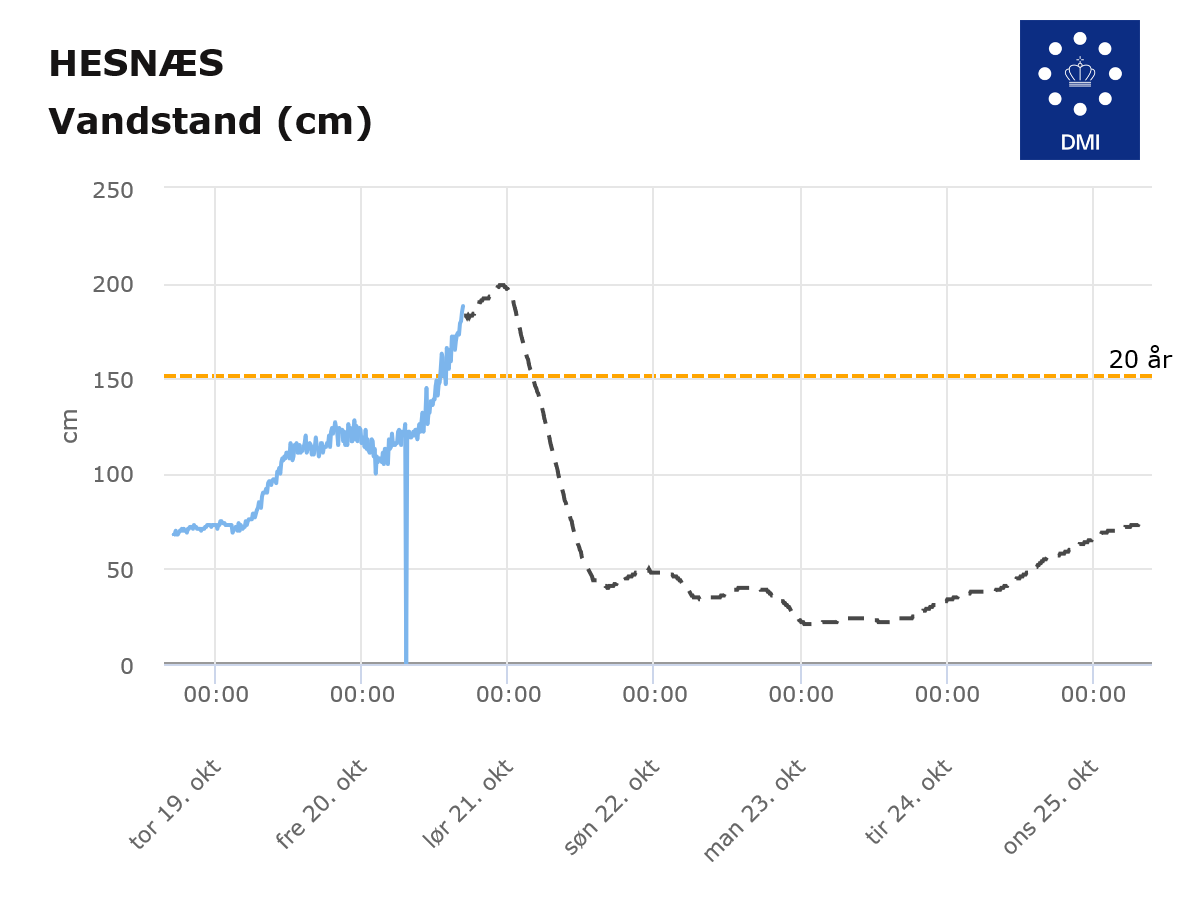
This piece is already too long, but there is one more aspect to consider. The harbour at Hesnæe Havn has just recorded a 100 year event, that is a storm surge like this would be expected to occur once ever hundred years, in this case the water is now 188cm. The previous record of 170cm was set in 2017. We need to prepare for rising seas and the economic costs they will bring. The sea will slowly eat away at Denmark’s coasts, but the frequency of storm surges is going to change – 20cm of sea level rise can turn a 100 year return event into a 20 year return event and a 20 year return event into an ever year event.
Screenshot of the observations of sea level from Hesnæs
We need to start having the conversation NOW about how we’re going to handle that disruption to our coastlines and towns.
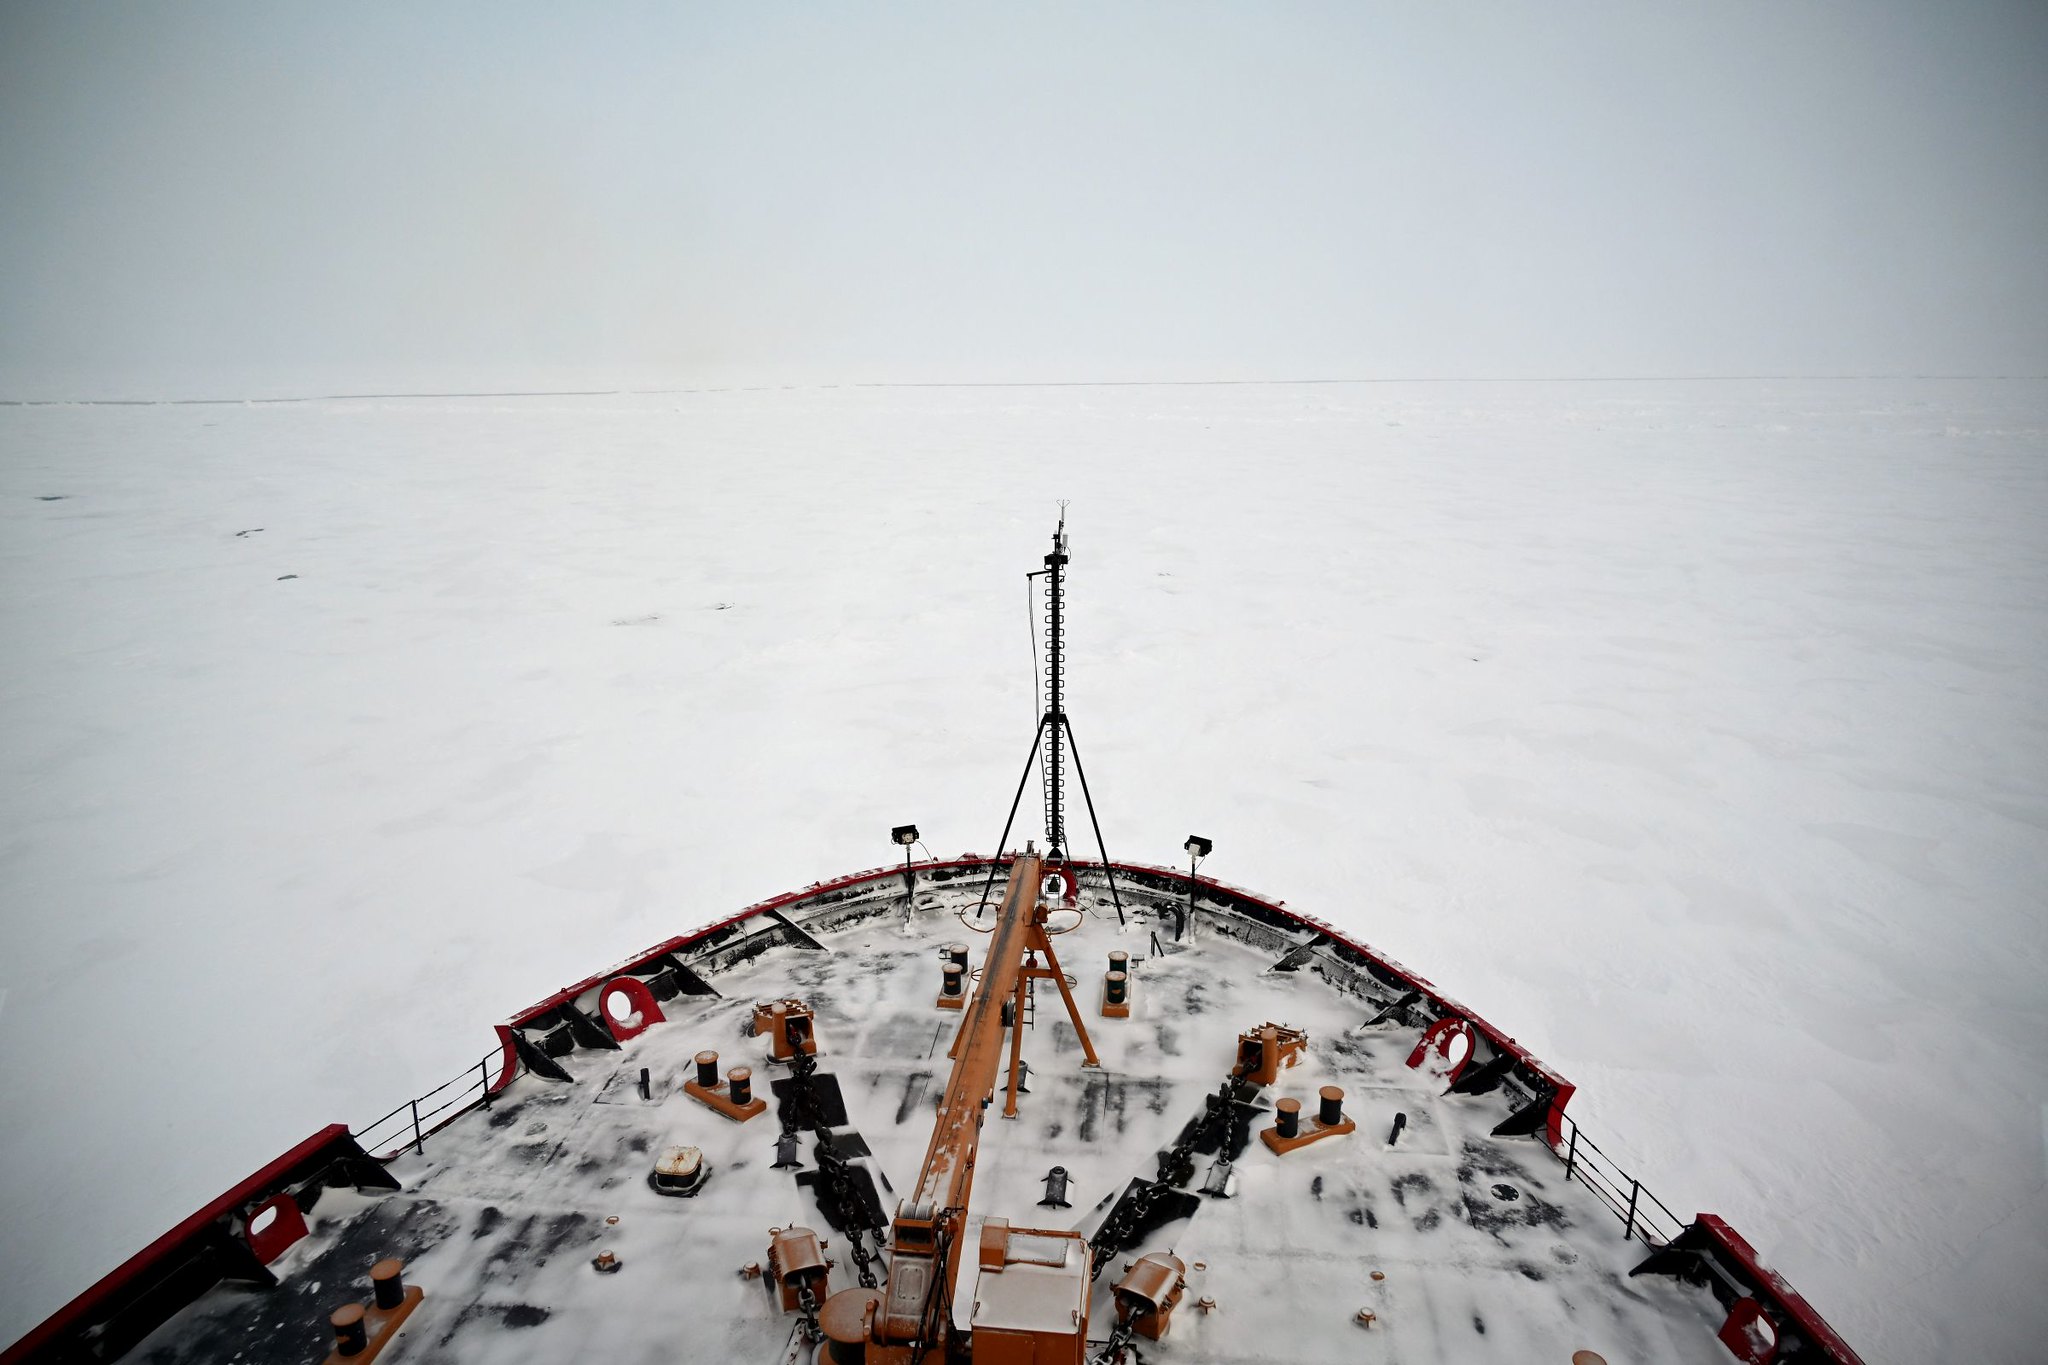
Following the invasion of Ukraine, Arctic exceptionalism is no longer. The region is reproducing deep divisions between Russia and the West in lower latitudes.
I’ve been asked before, often frequently in fact*, about how depressing it must be to be a climate scientist. And I usually waffle something about how, my job is very interesting and that there’s always hope out there somewhere. Like many people working in the climate space, I’m aware of the multiplicity of research out there suggesting that hope is essential for action, and so that’s what I try to emphasise.
And it is not inaccurate in fact, my job really is fascinating! And very often I get buried in learning something new and often surprising that is incredibly rewarding. I’m also surrounded by thoughtful, creative and incredibly smart and supportive colleagues. It’s a stimulating environment (both metaphorically and literally) and I’m learning new stuff all the time. It can sometimes be surprisingly fun. Occasionally, I’m even fortunate enough to go to Greenland.
Flying a UAV to measure icebergs in Greenland this year: Fieldwork is often uncomfortable, tedious and boring, but sometimes it can be surprisingly fun. Especially when learning new stuff. And the results of this research are consequential when it comes to sea level rise adaptation.
I’m sure that working in an emergency department or as a war photographer or social worker in a deprived community is considerably tougher mentally than how I have it..
On the other hand, Kimberley Miner’s piece resonated. Especially this year, where there have just been *so many* extreme events – including some that have a direct bearing on my own work. It has been exhausting keeping on top of what’s going on – and trying to communicate the impacts of that often feels like a moral duty as much as a part of my job. But it’s not always easy to cross that boundary. I rarely talk about my work in a social context (certainly if not with other scientists), it’s not exactly conducive to a party atmosphere. But I know police officers, social workers, soldiers and medics who are the same, I do not think climate scientists are alone in this respect.
I think she is also correct to point out that long working hours, stress, competition for resources and simple exhaustion don’t help. Given the academic environment, many of us work too much and don’t take the time to rest and recuperate. (Yes, I’m also writing this on a Sunday morning, where I’m also going through emails, editing comments on a paper and preparing for a new student to start next week…). It’s hard to keep perspective and emotions under control under those circumstances.
So what about the solutions?
Well, again I’d echo the original piece. Find the time and places that give you rest .
I jealously guard the time each week when I go out in my kayak on the Øresund, a sport I’ve enjoyed since my teens acquired a new urgency in preventing burn-out (particularly during the COVID times). It’s also often the time I get my best ideas and can work through issues that are bothering me to find the right way forward.
Paddlingon the Øresund, the wind turbines and the Copenhill facility are a reminder that we have solutions for the climate crisis. Even if it is not going as fast as it should…
And then, to continue a theme of posts this summer, it’s also about focusing on what can I do to feel empowered again. And I think this is also correct:
“After decades of working to convince the public that climate change is real, … we need to work on solutions…. The current generation of climate scientists needs to move on from education and advocacy to providing solutions for mitigation, adaptation and resilience. The best treatment for climate grief, .. is knowing you’ve made a contribution to reducing emissions or building resilience.”
But it’s important to remember too that many of us became climate scientists because we found it deeply interesting to work to understand the earth’s processes. Even if science has an even better understanding now, there is still much motivation in taking that deep dive.
At home, our own family lifestyle is in constant improvement to reduce our impact. The usual stuff: car free, vegetarian towards vegan lifestyle, train rather than plane as much as possible. This autumn, I’m adding a new wildflower patch to my garden to encourage the insects and pollinators even more. Individual actions won’t save the world or prevent the climate crisis alone, but they can help us to feel more in control and motivated.
Il faut cultiver notre jardin.
Voltaire
And a new update pointing at an interesting piece about how to incorporate this into an educational context with “critical hope”, which is sort of what I’m talking about here too.
This is where the notion of “critical hope” emerges as a compelling concept to explore.
Critical hope embodies an educational paradigm rooted in the art of envisioning and living an alternative narrative to the status quo.
This paradigm is fortified by a comprehensive scrutiny of our current predicament – urging learners and educators to not only understand the challenges we face but also to actively participate in reshaping our collective future.
I like this framing, but I do think we also have to remember that personal accountability and individual change is not going to solve the climate crisis. For that we need governaments and municipalities as well as business on board and, crucially, leading.
*There’s a whole other conversation we could have about how it’s very often women researchers who are asked about their feelings. Though I would also point out that for example, my colleague at GEUS Jason Box has also been open about this in this piece.
Climate adaptation will also most likely (going by previous history), be unevenly spread and probably not focussed on those feeling the biggest impacts, but those most able to pay for it.
This is something I’ve been pondering for a while, and I’m not really sure how to grasp it, but perhaps more and better work with the social scientists is necessary?
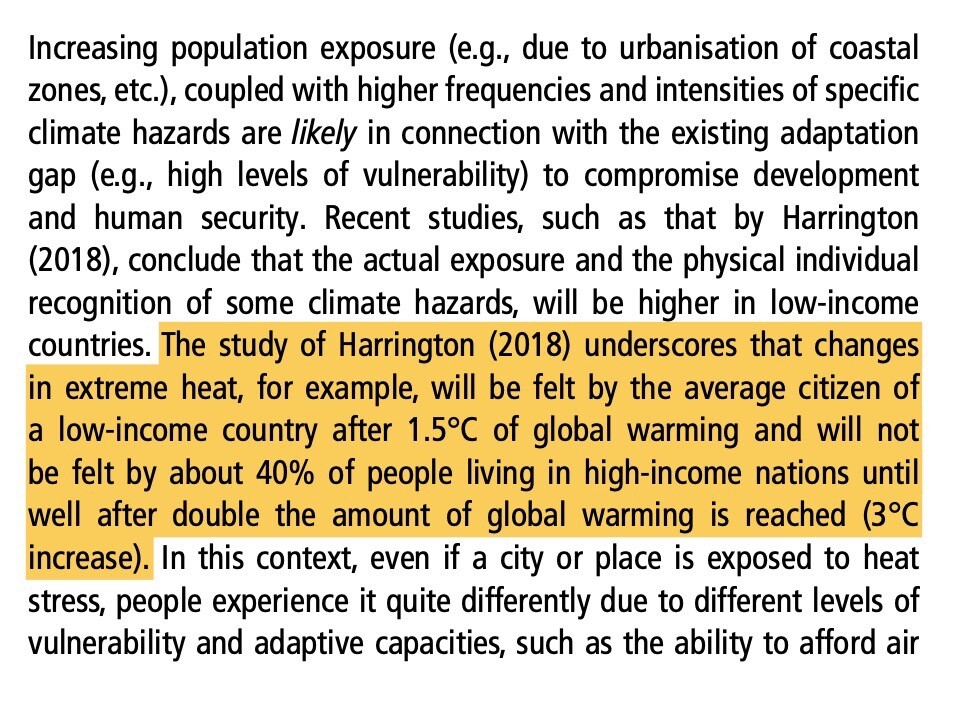
I was struck yesterday by this related snippet from the IPCC AR6 WGII report, posted by David Ho (and I gather courtesy Eric Rostrom), pointing out that heatwave impacts will be unevenly distributed between high and low income people.
At the same time, I also read an interesting piece in the Danish newspaper this weekend suggesting that heatwave exposure is a new marker of class, even in Europe. With the working class toiling in fields, roads, kitchens and on building sites, while the higher educated white collar professionals both able to take advantage of air conditioning and to afford time off in cooler places. This is not a new argument. But it is yet another argument for unions and robust government regulation to try to limit heatwave morbidity and mortality where this is possible. Trades unions may not be able to solve all problems, but they can definitely help when it comes to working conditions!
On a similar note, but outside Europe, the Economist has an unexpectedly excellent piece on how meteorology can help to mitigate weather and climate driven disasters . The whole piece is worth a read as it very much aligns with developments I can see at DMI. They point out for example the great possibilities offered by AI methods in weather forecasting, and how they can be applied to climate models (something I hope to start working on this year), as well as the dangers that AI could be used to undermine the robust national infrastructure that machine learning models are in fact built on.
However, the most important point is that so often, the main challenge is getting extreme weather warnings and other important information out to people affected.
“24 hours’ notice of a destructive weather event could cut damage by 30%, and that a $800m investment in early-warning systems for developing countries could prevent annual losses of $3bn-16bn.”
No breakthroughs are required to put this right, just some modest investment, detailed planning, focused discussion and enough political determination to overcome the inevitable institutional barriers. It is not an effort in the Promethean tradition of MANIAC’s [sic – an early pioneering weather supercomputer] begetters; it will neither set the world on fire nor model the ways in which it is already smouldering. But it should save thousands of lives and millions of livelihoods.
And this is probably generally true of the way we should think about climate change adaptation in the near and short term: how to leverage the best possible information to help make decisions and nudge behaviour to remove people from harm.
Or rather bootcamp. Or, if you (understandably) dislike the slight military overtones of the metaphor, call it a summer school or a hackathon instead….
This coming week I will be at the PolarRES Early Career Researcher (ECR) bootcamp for a few days. It’s being held at Søminestation, now a marine biology research station but also rented out for other academic activities, by Roskilde University Centre.
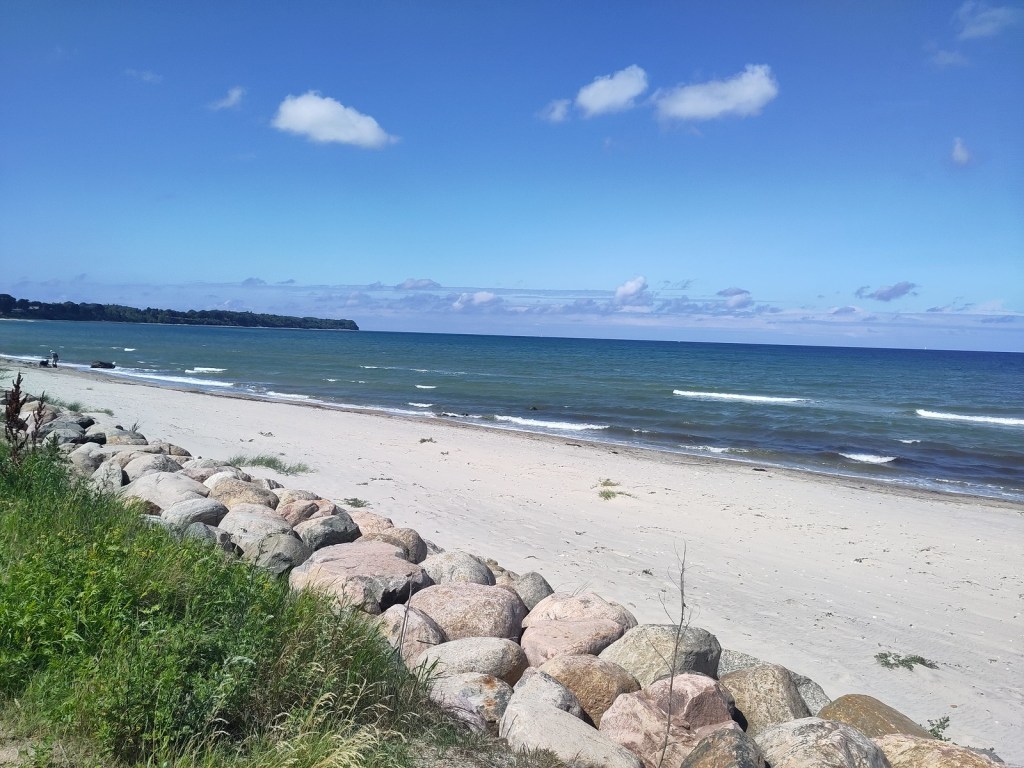
Behind the gorgeous beech trees on the edge of the fjord lies the Søminestation – now administered by Roskilde University Centre (RUC), mostly for marine biology applications I gather…
In a brilliant swords to ploughshares kind of theme, the station was originally owned by the Danish Ministry of Defence for developing and testing torpedoes. Happily, it’s now a place of sanctuary for busy scientists. It’s ridiculously idyllic, right on the edge of the fjord with a tiny beach which makes swimming easy and safe, lots of wildlife to enjoy and a recently renovated interior in impeccable Danish minimalist style.
The buildings are nestled in the forest with trails all around and it’s reached on quiet roads perfect for cycling. Food is delivered daily by a catering company and the bootcamp participants sort their own breakfast and lunches from a large assortment put out in turn by small groups. It’s a really perfect location for team building and reading weeks.
This is actually the 2nd bootcamp I’ve attended there. I organised the last one at the same place last October, in collaboration with many colleagues and fellow members on the NORP panel.
Then, the bootcamp subject was the Arctic and how well the CMIP6 global climate models (as used by the IPCC in their Sixth assessment report) represented the important processes. We had 23 students and 10 mentors, working on various aspects of this big problem for 10 days. We covered everything from sea ice to ocean circulation to atmospheric teleconnections to the Greenland ice sheet (natch).
This artificial jetty was built to help launch torpedoes on a firing range in the 1930s to 1960s, now it’s a nice spot for a group of young scientists to take a walk and talk
They’re also exhausting. And I don’t think I was the only one who went home after 10 days last year and basically crashed for a week.
On the other hand, there will almost certainly come at least 3 publications from last year’s bootcamp. I wouldn’t be surprised if this year had a similar count. It’s a really brilliant way to get a lot of high quality work done in a short space of time.
It was overall a fantastic experience – albeit rather hectic, not least because we had to delay twice due to Corona, as did many other people so it was back to back with far too many other meetings. However I’d love to do another one, I find them incredibly stimulating and exciting from a scientific viewpoint. So I leaped at the opportunity to come back for a few days for the new PolarRES organised effort.
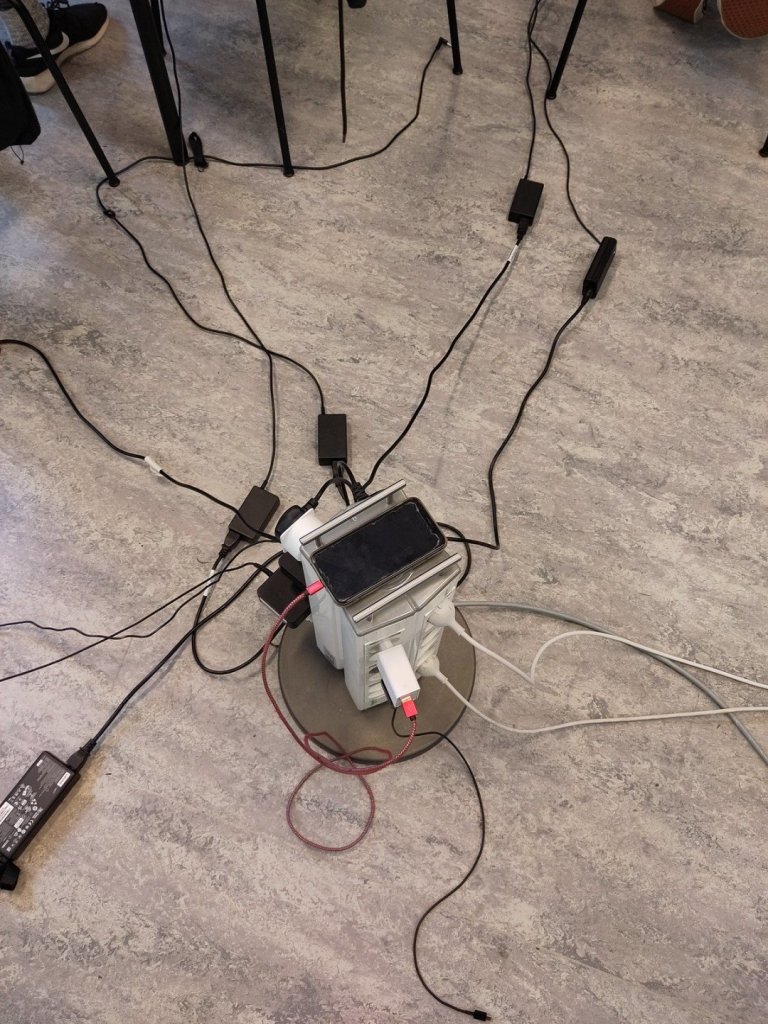
Dawn swimming in the Holbæk fjord by SøminestationDon’t get the wrong impression, the work sessions at this bootcamp started at 8.30am and often went long into the evenings. It’s not just the people but the IT equipment that’s working hard… Thanks to strong winds during the bootcamp most of the energy used in Denmark was renewable, but we also relied quite a lot on cloud infrastructure to power data analysis. That’s going to be the next target to decarbonise.
I will sadly not be attending the full week – I have family commitments- but I will lecture the first day (on “Hot topics in polar climate”: would love to hear your ideas on that in the comments…) And I’ll be around a few days to help support the group work as far as I can.
I’m mainly planning on using the time to prepare a talk for the IUGG meeting, and to write a draft paper. Both of these tasks already involve many of the early careerers at the bootcamp so it’s also a great opportunity for me to get a few things done.
It probably points to some of the problems in the working world, that I actually need to leave the office in order to get some work done…
Time to get back to the beach.
The beach at Søminestation: “I do not know what I may appear to the world, but to myself I seem to have been only like a boy playing on the seashore, and diverting myself in now and then finding a smoother pebble or a prettier shell than ordinary, whilst the great ocean of truth lay all undiscovered before me.” Attributed to Isaac Newton (allegedly)
Today the European Council is debating (behind closed doors), the proposed Nature Restoration Law – there has been heavy lobbying by several EU countries to water down the provisions. I believe this is a mistake and last week I and almost three and a half thousand other scientists signed a petition saying so.
It has now been reopened for signatures. Please do sign if you feel strongly about it. It’s worth a read anyway as the organisers (probably being scientists!) have written out what the agreement means in admirable clarity:
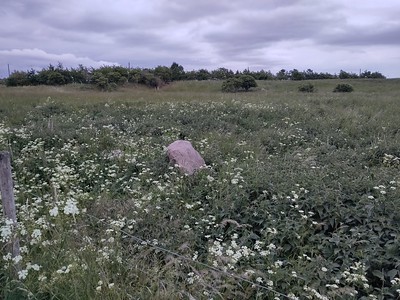
Rough land which has been allowed to turn into a wildflower haven in Copenhagen
I am a climate scientist who has become increasingly interested in and concerned about biodiversity. I have had a deep love and sense of wonder about nature since I was a kid – and probably my interest in glaciers and weather and climate have in in part grown out of that. I’m not a biodiversity expert, but I am acutely aware of the impact climate change is already having on the biosphere. It is at a fundamental level very hard to separate climate from biodiversity and probably unwise to try.
In the past I’ve considered it was a scientist’s duty to advise impartially and therefore to be politically completely inactive, I have regretfully come to the conclusion that actually, maybe we as a community do need to push a little more firmly in the direction our science is actually pointing us. Perhaps it is in fact irresponsible not to be involved?
As the great atmospheric chemist and Nobel Laureate Sherwood Rowland once said (in 1986!):
“After all, what’s the use of having developed a science well enough to make predictions, if in the end all we’re willing to do is stand around and wait for them to come true?”
The petition I linked to above has been organised by german scientists, experts in ecology and biodiversity. They emphasise:
“Being proactive is thus important. We would therefore appreciate if you found your way of communicating this letter in your surroundings, and help delivering the science to whoever may be interested in it. The purpose is not to lobby but rather to support, to offer help, maybe even mediate where possible.”
We’re scientists and we’re also public servants.
Use us to help guide policy. If scientists are ringing alarm bells, then somewhere there is a fire…
Yellow flag iris around a wildlife rich garden pond.
In the before times I would usually spend this week walking around a world class city humming an old 80’s hit (- don’t ask me why it was so durable in my head, probably something to do with being an impressionable age at a time when access to pop music meant half an hour on a Thursday evening).
Anyway, it is the time for EGU… Sadly I will not be wandering the streets of the ever beautiful (and most livable) capital of Austria this year. I have to get some actual work done, but I’m following the #EGU23 on mastodon and hoping to catch a few highlights on the sides. I do have a poster, which will be capably presented by PolarRES PI Priscilla Mooney and my DMI Colleague Abraham Torres on Thursday.
The topic is our PolarRES project – an ambitious Horizon 2020 effort to produce a large ensemble of regional climate simulations over both poles. These are state-of-the-art regional climate models run at unprecedented high spatial resolution and all data will be made open access and free via the CORDEX project.
I will also put it here later – feel free to comment here or ask questions on mastodon or get in touch by email if it sounds exciting.
Other posters and talks I’ve contributed to from PolarRES are
Kristiina Verro’s talk on HCLIM_Arome results from the Antarctic peninsula:
Verro, K., van de Berg, W. J., Orr, A., Landgren, O., and van Ulft, B.: New non-hydrostatic polar regional climate model HCLIM-AROME: analysis of the föhn event on 27 January 2011 over the Larsen C Ice Shelf, Antarctic Peninsula, EGU General Assembly 2023, Vienna, Austria, 24–28 Apr 2023, EGU23-13864, https://doi.org/10.5194/egusphere-egu23-13864, 2023.
Abraham Torres joined our group last year and is primarily working on PolarRES also. He will show some of our preliminary HCLIM results for both the Arctic and the Antarctic
Torres-Alavez, A., Landgren, O., Boberg, F., Christensen, O. B., Mottram, R., Olesen, M., Van Ulft, B., Verro, K., and Batrak, Y.: Assessing Performance of a new High Resolution polar regional climate model with remote sensing and in-situ observations: HCLIM in the Arctic and Antarctica, EGU General Assembly 2023, Vienna, Austria, 24–28 Apr 2023, EGU23-14090, https://doi.org/10.5194/egusphere-egu23-14090, 2023
Quentin Glaude is a collaborator from Liege in the Horizon 2020 PROTECT project on sea level rise contributions from the cryosphere . Baptiste Vandecrux, a former PhD student with me here and now working at GEUS is also presenting some work based on the same models as Quentin, with a comparison to the PROMICE observation statons on the Greealnd ice sheet. It’s very cool application of machine learning and the results are very interesting.
Glaude, Q., Noel, B., Olesen, M., Boberg, F., van den Broeke, M., Mottram, R., and Fettweis, X.: The Divergent Futures of Greenland Surface Mass Balance Estimates from Different Regional Climate Models, EGU General Assembly 2023, Vienna, Austria, 24–28 Apr 2023, EGU23-7920, https://doi.org/10.5194/egusphere-egu23-7920, 2023
Vandecrux, B., Fausto, R. S., Box, J. E., Covi, F., Hock, R., Rennermalm, A., Heilig, A., Abermann, J., Van As, D., Løkkegaard, A., Fettweis, X., Smeets, P. C. J. P., Kuipers Munneke, P., Van Den Broeke, M., Brils, M., Langen, P. L., Mottram, R., and Ahlstrøm, A. P.: Historical snow and ice temperature compilation documents the recent warming of the Greenland ice sheet, EGU General Assembly 2023, Vienna, Austria, 24–28 Apr 2023, EGU23-9080, https://doi.org/10.5194/egusphere-egu23-9080, 2023.
Nicolaj Hansen (who finished his PhD with me and Sebastian Simonsen at DTU Space last year) has just submitted a beauty of a paper which he will talk about – also partof PROTECT.
Hansen, N., Sørensen, L. S., Spada, G., Melini, D., Forsberg, R., Mottram, R., and Simonsen, S. B.: ICESat-2 Ice Sheet Mass balance: Going below the surface, EGU General Assembly 2023, Vienna, Austria, 24–28 Apr 2023, EGU23-12349, https://doi.org/10.5194/egusphere-egu23-12349, 2023
Mathias Larsen is a current Phd student with me and is presenting a poster on the CARRA dataset and an application in surface mass balance modelling. This work falls under the danish National center for klima forskning
Larsen, M., H. Mottram, R., and L. Langen, P.: CARRA-driven simulation of Greenland Ice Sheet surface mass balance at 2.5 km resolution, EGU General Assembly 2023, Vienna, Austria, 24–28 Apr 2023, EGU23-5852, https://doi.org/10.5194/egusphere-egu23-5852, 2023
Last year I co-organised a bootcamp for early career researchers on Arctic processes in the CMIP6 models. It was super fun and would not have been possible without the support offered by Anne Fouilloux, Tina Odaka and colleagues from the Pangeo project. Their poster is super interesting and if you’re interested in optimising the use of big climate data, go and check it out!
Fouilloux, A., Marasco, P. L., Odaka, T., Mottram, R., Zieger, P., Schulz, M., Coca-Castro, A., Iaquinta, J., and Eynard Bontemps, G.: Pangeo framework for training: experience with FOSS4G, the CLIVAR bootcamp and the eScience course, EGU General Assembly 2023, Vienna, Austria, 24–28 Apr 2023, EGU23-8756, https://doi.org/10.5194/egusphere-egu23-8756, 2023.
Excitingly, at least 3 of the projects at the bootcamp will also be presented at EGU this year. So, lots to be getting on with, for now, here’s a link to Ultravox’s finest…