Lessons from a year in the fediverse…
It’s been almost a year since I started to seriously explore Mastodon and the rest of the fediverse. I wrote a piece on here in December 2022 and again in February 2023 as I transferred pretty much all my activity to mastodon. There are other competitors to the dead bird site, and mastodon is not a complete replacement for the site formerly known as twitter, but it’s also very clear that in spite of recent improvements, it’s still quite hard for people to transfer. If at this point you want to skip ahead to the quick start go ahead, but indulge me a little justification first, there is a point, I promise…
EDIT: if you’re just here looking for good climate follows, the climate migration account at mastodon.world has put together this great list. Did you know you can import .CSV formatted files of accounts on mastodon?
As to why you should transfer or at least consider diversifying to different platforms? Well, we all have our own thresholds, but the increasingly appalling behaviour of the new owner means I certainly do not regret my decision to switch last year. I did not and do not want to have my “content” making X or whatever you call it now money either. If you wouldn’t buy a newspaper given outrageous racism and circulation of misinformation, then it’s probably worth asking yourself if there’s any difference posting to a social media site that has been proven to be a haven for trolls and one of the most active ways that misinformation spreads.
So where then? Well it’s a fractured social media environment today and as I wrote before, I’ve ended up blogging a lot more. And it’s been fun. I’ve really enjoyed restarting this effort.
I have been offered a couple of BlueSky invites, and I may check it out, but it will never be an “only” because that would suggest we have learnt nothing from handing over control of our digital lives to yet another VC funded start-up. If their promises of interoperability come good, I may review this opinion. I might start to share these wordpress posts over at Substack too – though there also the ownership gives me pause, I will certainly not allow it to be come the one platform to rule them all.
This excellent post by Elizabeth Tai put it much better than I can. And at least with Mastodon I have much more control and ownership over my own content and my own data – nobody is trying to monetise me.
“The Twitter meltdown made me realize something important: I’m a seriously prolific content creator. And I’ve been giving away all that content free to a platform that not only profits from it but treats me
Essayist Elizabeth Tailike garbageunfairly when it comes to sharing said profits. Meaning, they don’t share a dime. When I downloaded my Twitter archive, it hit me like a ton of bricks that most of that content was not sitting in my website, so they could just disappear if a billionaire decides to cut me off from the platform.”
The point of course is that we do not need to be bound to just one platform, it takes time and effort but it is still possible to share in more than one place, if we can keep out of the walled gardens. In the future my strategy is probably something like longer thoughts and pieces here, probably also shared on substack at some point (if relevant) and then shared out via mastodon, where I’m on the fediscience server – and if you’re a scientist you might want to join too (see point one below though) and linked in (yes I know, weird, it’s like a zombie, keeps coming back and seems to be booming). But it will not go on the dead bird site, nor the meta site (which I left long before for basically similar reasons) and certainly not after the latest lurch into
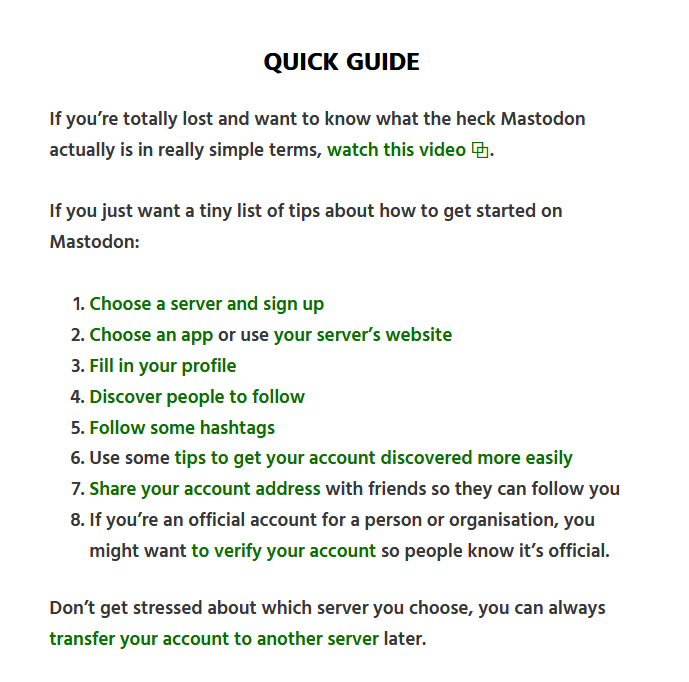
So to the point of this post. Hopefully you got to this part and you’re thinking, great. Where do I start?
Here’s a really quick start guide from fedi.tips who you should probably also start by following (@feditips@mstdn.social). And while we’re on that subject, maybe try @FediFollows too- the same person (group?), highlights interesting accounts to follow under a particular theme every day. Worth a look.
You can also Check out this slightly longer list of helpful resources by fedi.tips.
Now to repeat: Mastodon is *a bit* like Twitter, but it’s not quite the same. You’ll probably have to use it a bit to get used to it. Now twitter, used to be thought of as “difficult” too. It really was (as an ancient episode of Dr Who proves, the place only nerds went to hang out). The last I read (may no longer be accurate), only 10% of the people who set up accounts were active a year later. So it does take some time to get used to a new platform and you should definitely bear that in mind.
Social media needs to leverage network effects. it takes time to get to the stage of “but this is how it’s always done”. With that in mind, and given that social media is absolutely not for everyone, here are some tips (based only and in a completely biased way, on my own experiences)
- Mastodon works on servers – it really doesn’t matter that much which server you choose initially, but you probably want to avoid the really big ones. They are sometimes unstable and it can be difficult to follow. There’s a huge range from single user servers (called instances) to large language/country/interest based ones. I’m on fediscience.org. You can use the servers page on joinmastodon.org to find one you think sounds interesting. And if you don’t like it you can switch (and take your followers with you, though not your posts). Within mastodon you will have a button to see what other people on your server are posting, so choosing something relevant and larger may help at first. (Map nerds might like to check out this beautiful visualisation tool -see what I mean about the creativity and do it yourself attitude of the fediverse?)
- Set up your profile with as much detail as possible, include an OrcID, a personal webpage, some interests so people can see who you are if that’s important. it’s also fine to be anonymous on the fediverse though. You decide.
- Make an introduction post, tagged #introduction and if you know a few people already on there tag them too. If they are on different servers to you will need to include the server address. In much the same way that an email to @alice is not going to arrive but an email to @alice@emails.com will.
- Follow a lot of people. And I mean really a lot. At first you may want to follow all the people you can find, they will be your algorithm, you can easily prune back later.
- Use lists to organise by topic or interest. For instance i have one for climate scientists, one for danish mastodon, one for press accounts – it’s an easy way to curate your feed a bit.
- More on finding people to follow: There’s a github for that which includes many curated lists on specific topics. If you’re following me, it’s quite likely you’re interested in earth science, so here’s a list to check out and to add yourself too if you want. You can also download and upload lists of followers in csv format which is quite helpful for bulk following. Once you have a few followers there’s a handy tool called followgraph that will scan your followers and they look at who they follow to help you find similar accounts
- Boost much more than you think you need to, including reupping your own posts to catch different audiences at different times of day (it’s like twitter before the algorithm became so dominant). Likes just make the person who posted feel warm fuzzy. There is no algorithm! You have to make your own feed
- Follow hashtags to find good content and new accounts that interest you. As an example I follow #Birds, #Ukraine #mosstodon + #SeaLevelRise among others. Some user interfaces (e.g. Halcyon.social) allow you to read these in the same way you would on tweetdeck. Sprinkle your posts liberally with hashtags too.
- Try out different apps to find the one you like best. I have been mostly using Tusky on my phone but I’m now testing fedilab too. I believe you have even more choice on iphones On the desktop using elk.social gives a very beautiful interface.
- Put in some effort to curate your own experience in the early days. You’ll need to work at it the first few weeks to find good accounts, hashtags etc to follow. Don’t expect everything to be served up on a plate, it’s different here. As I already said, it’s hard to remember how much like hard work twitter was at this stage and Mastodon is doing it on a shoestring budget.
- If you experience harassment and spam, and I’m sure it happens, though I’ve not seen anything like the abuse on the dead birdsite, report and block. If you have a good instance admin they will be on it straight away. If you don’t, move to a different instance. Unfortunately mastodon does have its share of reply guys. I just shrug and ignore. They seem to go away. If they don’t, see above.
- Give it time. To build up a network and a feed takes time. Invest a little and you’ll find you reap rewards. And remember to boost much more than you think is necessary.
- Some additional tips: check your preferences in your profile. If you are hoping to connect with others with a similar interest, make sure you are findable.
- You can set a post to have different levels of visibility. I usually post to everyone, but sometimes I might make replies unlisted so people don’t get their timelines spammed with a long thread. Be aware that direct messages between you and other users are not encrypted and can easily be read by your instance admin (Mind you there is evidence this is true of twitter too – this story is another reason to get off the platform in my opinion).
I think this is about it. If you find it useful or if you have stuff to add please feel free to leave a comment. There is in fact a wordpress ActivityPub plug-in that allows comments to crosspost to mastodon, which I may investigate at some point, when I have time.
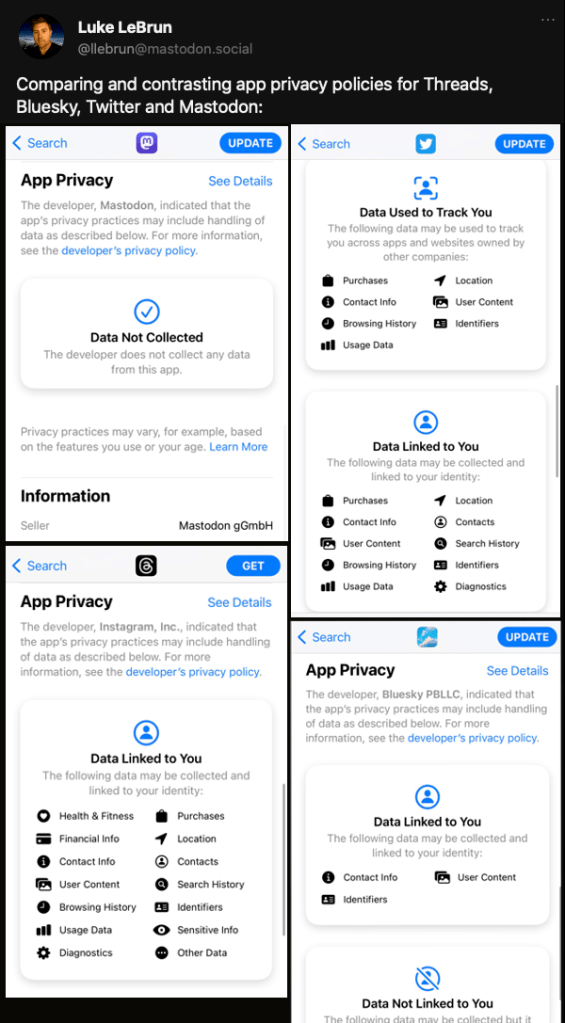
A final thought, different people have different tolerances for privacy and data sharing – as I’ve got older, and frankly as I’ve been more on mastodon where people talk about this stuff, and refuse to take for granted the normal tracking that happens elsewhere in the web, my tolerance for being tracked has gone down and down, so here is something else to consider.
And that should be that, except:
I have an extra message to governmental institutes and agencies.
Does this sound familar?
“I represent a government agency, all our users are on twitter/X/facebook”
I would argue that the last thing governmental agencies should be doing is supporting or relying on these commercial platforms, especially if your job is to distribute information important for public safety or wellbeing. Your users are there, because you are there – they will find other ways to access your info if you do.
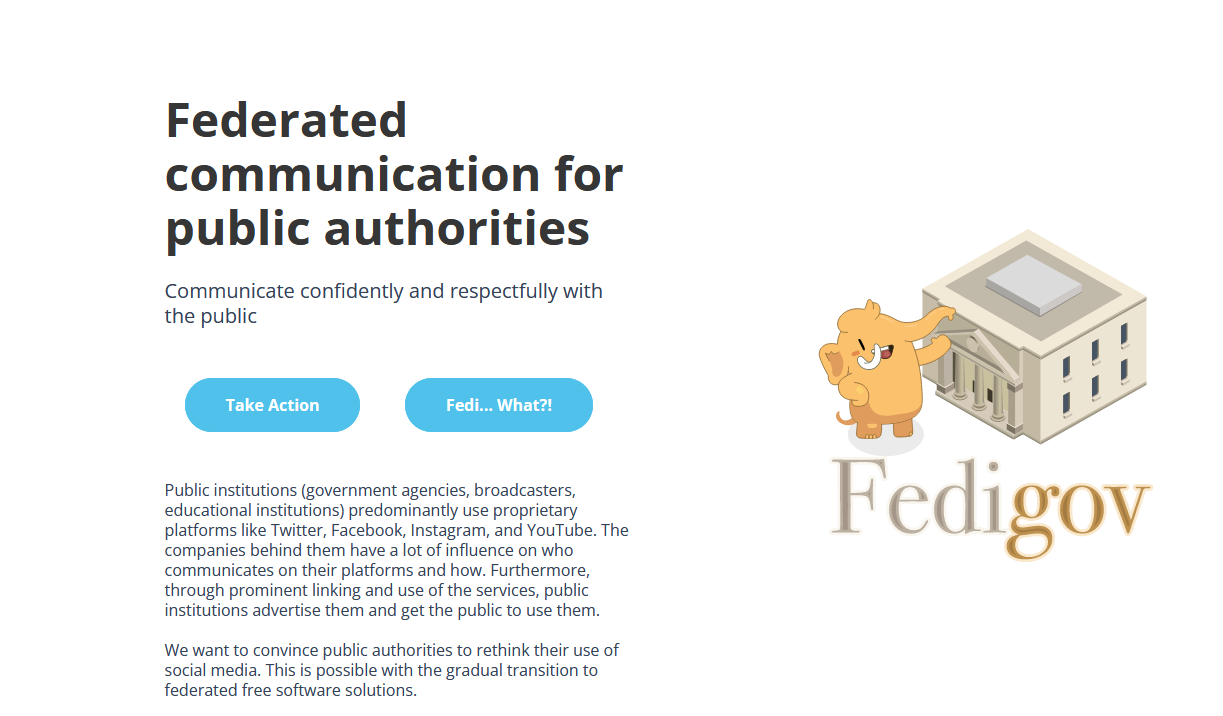
If you’re a government employee, you might want to draw your employer’s attention to the very helpful FediGov.eu – why? Well as their website says:
“Sovereignty Digital sovereignty pursues the goal of enabling the independent and self-determined use and design of digital technologies by the state, the economy and individuals. Decentralized free software solutions, give all people and organizations the right to use, understand, distribute and improve them for any purpose. This is a cornerstone for our democracy in an increasingly digitalized society.
Privacy The public should not be forced to pass on their data to large corporations in order to be able to communicate with public institutions. The public administration should support the public in data protection and therefore also offer alternatives.
Public funds When using taxpayers’ money, care must be taken to ensure that it is used efficiently and effectively. The procurement, provision and use of free software solutions must therefore be the focus of digitization.
Legal certainty The use of social networks by large, globally active digital corporations is difficult to reconcile with European data protection laws. As a public authority, it is necessary to ensure a legally compliant communication for the public. In the area of social networks, public institutions and authorities must therefore also rely on federated free software solutions!”
The German and Dutch governments have already set-up their own instances. Shouldn’t you be using them or setting up your own if you live in a different country?