Most people outside of Denmark know about hygge these days, but the term janteloven is less familiar. For British readers the most appropriate translation would be tall poppy syndrome.
Anyway, I’ve hesitated a bit to write this post a bit, but at the same time I am delighted and proud and actually a bit surprised to have been awarded an honorary Professorship at Aarhus University.
My very kind and extremely smart former boss at DMI, Professor Peter Langen, now leads the Environmental Science Department at Aarhus University (actually based at Risø near Roskilde and not in Aarhus). He put me and my amazing and very talented colleague Shuting Yang forward to the University for this honour earlier this year and we heard just before the summer break it had been accepted.
It’s a purely honorary position, so I don’t get paid by the University, on the other hand it doesn’t come with any obligations either and it lasts for 5 years. I’m hopeful though that it will lead to new and exciting collaborations and maybe even new studentships and other programmes. I’ve always enjoyed working with students, so if you’re at Aarhus University and looking for a thesis supervisor working on polar climaet and ice sheets, give me a shout.
I already co-supervise one PhD with the Environmental Science department and I’m extremely impressed with the calibre of research there. The universe moving, as it does, in mysterious ways, a few days ago we also got good news about Horizon Europe funding that will also facilitate closer working with AU so watch this space for more on that front.
Now I guess it’s time to start thinking about an inaugural lecture or something and I’m looking forward to exploring the rather beautiful fjordside campus of Risø when I get chance.
There is currently some discussion in the Danish media about sea level rise hazards and the risk of rapid changes that may or may not be on the horizon. Some of the discussion is about IPCC estimates. That’s a little unfortunate and in fact a bit unfair as the IPCC report has not been updated since 2021, nor was it intended to have been. In the mean time there has been a lot of additional science to clear up some of the ambiguities and questions left from the last report.
I’ve been working quite a bit on the cryosphere part of the sea level question of late, so thought I’d share some insights from the latest research into the debate at this point. And I have a pretty specific viewpoint here, because I’ve been working with the datasets, models, climate outputs etc that will likely go into the next IPCC report as part of a couple of EU funded projects. As part of that, we have prepared a policy briefing that will be presented to the European Parliament in June this year, but it’s already online now and will no doubt cross your socials later this week. I’m going to put in some highlights into this post too.
Now, I want to be really clear that everything I say in this post can be backed up with peer reviewed science, most of which has been published in the last 2 to 3 years. Let’s start with the summary:.:
The sea is rising. And the rate of rise is currently accelerating.
The sea will continue to rise long into the future. The rate of that sea level rise is largely in our society’s hands, given that it is strongly related to greenhouse gas emissions.
We have already committed to at least 2m of sea level rise by 2300.
By the end of 2100 most small glaciers and ice caps will be gone, mountain glaciers will contribute 20-24% of total sea-level rise under varying emission scenarios.
Antarctic and Greenland ice sheet mass loss will contribute significantly to sea-level rise for centuries, even under low emissions scenarios
Abrupt sea level rise on the order of metres in a few decades is not credible given new understanding of key ice fracture and iceberg calving processes.
By the end of this century we expect on the order of a half to one metre of sea level rise around Denmark, depending on emissions pathway. (If you want to get really specific: the low-likelihood high impact sea level rise scenario corresponds to about 0.9 m (on average), or at the 83rd percentile, about 1.6 m of sea level rise).
Your local sea level rise is not the same as the global average and some areas, primarily those at lower latitudes will experience higher total sea level rise and earlier than in regions at higher latitudes.
Sea level rise now is ~5mm per year averaged over the last 5 years, 10 years ago it was about 3 mm per year). Much of that sea level rise comes from melting ice, particularly the small glaciers and ice caps that are melting very fast indeed right now. Even under lower levels of emissions, those losses will increase. There won’t be many left by the end of this century.
Greenland is the largest single contributor and adds just less than a millimetre of sea level rise per year, with Antarctica contributing around a third of Greenland, primarily from the Amundsen Sea sector. The remaining sea level rise comes from thermal expansion of the oceans. Our work shows very clearly that the emissions pathway we follow as a human society will determine the ultimate sea level rise, but also how fast that will be achieved. The less we burn, the lower and slower the rise. But even under a low-end Paris scenario, we expect around 1 metre of sea level by 2300.
The long tail of sea level rise will come from Antarctica, where the ocean is accelerating melt of, in particular, West Antarctica. However, our recent work and that of other ice sheet groups shows that the risk of multi-metre sea level rise within a few decades is unrealistic. Again, to be very clear: We can’t rule out multiple metres of sea level rise, but it will happen on a timescale of centuries rather than years. High emissions pathways make multiple metres of sea level rise more likely. In fact, our results show that even under low emissions pathways, we may still be committed to losing some parts of especially West Antarctica, but it will still take a long-time for the Antarctic ice sheet to disintegrate. We have time to prepare our coastlines.
There’s so much more I could write, but that’s supposed to be the high level summary. Feel free to shoot me questions in the comment feeds. I’ll do my best to answer them.
Five years ago, a small group of European scientists got together to do something really ambitious: work out how quickly and how far the sea will rise, both locally and on average worldwide, from the melting of glaciers and ice sheets. The PROTECT project was the first EU funded project in 10 years to really grapple with the state-of-the-art in ice sheet and glacier melt and the implications for sea level rise and to really seek to understand what is the problem, what are the uncertainties, what can we do about it.
We were and are a group of climate scientists, glaciologists, remote sensors, ice sheet modellers, atmospheric and ocean physicists, professors, statisticians, students, coastal adaptation specialists, social scientists and geodesists, stakeholders and policymakers. We’ve produced more than 155 scientific papers in the last 5 years (with more on the way) and now our findings are summarised in our new policy briefing for the European Parliament.
It’s been a formative, exhilarating and occasionally tough experience doing big science in the Horizon 2020 framework, but we’ve genuinely made some big steps forward, including new estimates of rates of ice sheet and glacier loss, a better understanding of some key processes, particularly calving and the influence of the ocean on the loss of ice shelves. More importantly for human societies, by integrating the social scientists into the project, we have had a very clear focus on how to consider sea level rise, not just as a scientific ice sheet process problem, but also how to integrate the findings into usable and workable information. In Denmark, we will start to use these inputs already in updating the Danish Climate Atlas. If you are elsewhere in the world, you may want to check out our sea level rise tool, that shows how the emissions pathway we follow, will affect your local sea level rise.
Our final recommendations?
Accelerate emission reductions to follow the lower emission scenario to limit cryosphere loss and associated sea-level rise
Enhance monitoring of glaciers and ice sheets to refine models and predictions
Support the long-term development of ice sheet models, their integration into climate models, and the coupling of glacier models with hydrological models, while promoting education and training to build expertise in these areas
Invest in flexible and localized coastal management that incorporates uncertainty and long-term projections
Foster international collaboration to share knowledge, resources, and strategies for mitigating and adapting to global impacts
This is the first in a two-parter. At this time of year, posts making bold statements about what happened last year and what we plan to do this year start to become prominent. The last few years I have spent a few hours in the first week of January reviewing what worked, what was fun and what was cool, what was awful and what definitely was a waste of time. I’m not honestly sure that any of this is of interest to anyone except me, so read on, but you have been warned..
2024: Themes of this year: Greenland, Machine Learning, people, and big data…
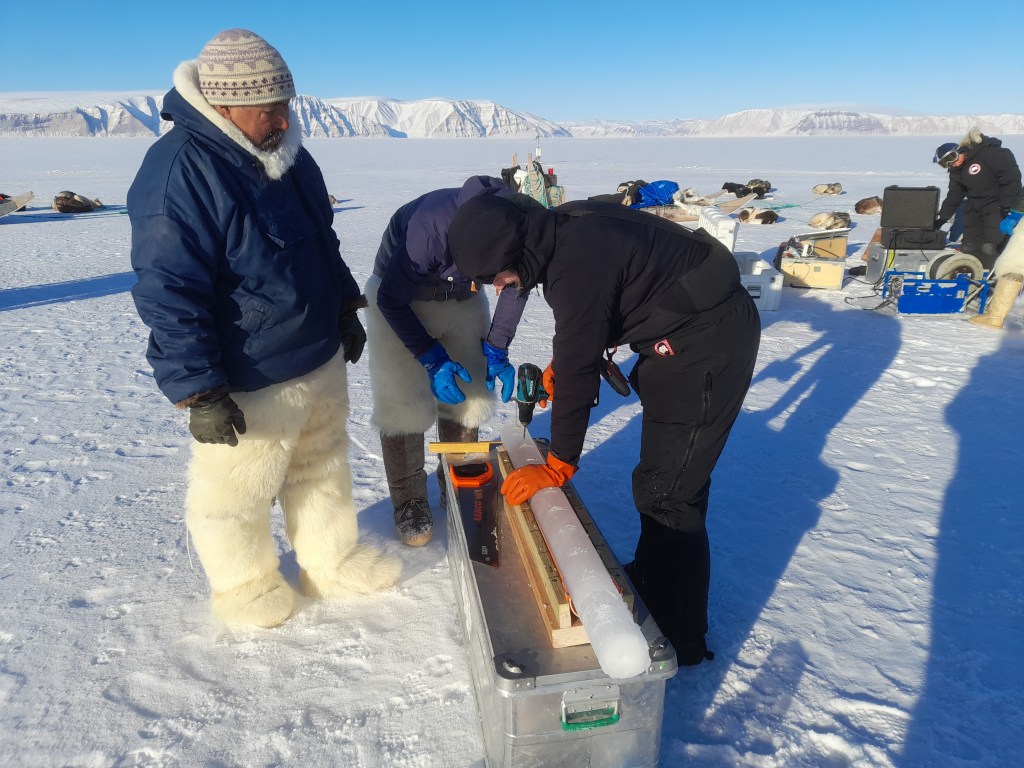
Working with scientists from the Greenland natural resources institute and local hunters on the sea ice.
The final trip was in October for a workshop with scientists in Greenland about climate change impacts in Greenland, the subpolar gyre and AMOC for the UN Ocean decade. It was a memorable meeting for the sheer range and quality of science presented as well as for being stranded in Nuuk by a broken aeroplane in quite ridiculously beautiful weather (I mostly stayed in my hotel room to write the aforementioned paper, sadly. In 2025 I will work on my priorities) .
Apart from fieldwork I have really tried hard on publications this year. I have (like many scientists I suspect), far more data sitting around on hard drives than I have published. It’s a waste and it’s also fun to work on actual data instead of endless emails. This is something I intend to continue focusing on the next few years as well. There is gold in them thar computers…
We had a couple of writing retreats were very successful. These I plan to continue also and the PRECISE project grant is happily flexible enough to do this. I probably achieve as much in terms of data processing and paper writing in 3 focused days as I would in 3 months in the office. It paid off too. I managed to co-author 8 papers published this year (including my first 1st-author paper in ages – a workshop report, but nevertheless it counts.). Some of these are still preprints, so will change, and there are a couple more that have been submitted but are not yet available as preprints. I will submit two more papers in the next 3 weeks as well (1 first author), so January 2025 is going to be the 13th month of 2024 in my mind.
Bootcamps have been a theme the last 3 years, I organised the first in 2022 and so far there have been 4 publications from that first effort. There was another this year in June, ( I have attended them in 2023 and 2024 but was not organising) where we really got going on a project for ESA that I have had my eye on for a while – I hope the publication from that will be ready in the Spring this coming year.
Machine Learning: This was the year I really got machine learning. I’ve been following a graduate course online, and learning from my colleagues and students about implementations. I understand a lot more about the architecture and how to in practice apply neural networks and other techniques like random forests now. This is not before time, as we intend to implement these to contribute to CMIP7 and the next IPCC report. We still have a lot of work to do, but the foundation is laid. And it’s been fun to learn something that, if not exactly new, is a new application of something. In fact the biggest barrier has really been learning new terminology. We have also been fortunate that Eumetsat and the ECMWF have been very helpful in providing us with ML-optimised computer resources to test much of these new models out on. We’re actually running out of resources a bit though, so it’s time to start investigating Lumi, Leonardo and the new Danish centre Gefion to see what we can get out of these.
People: This year our research group has grown with another 2 PhD students, and at the end of the year we also employed a new post-doc. I think it’s large enough now. I’m very aware that if I don’t do my job properly, then not only the research but the people will suffer, so developing people management skills is really important. In any case it’s extremely stimulating to work with such talented young people and I’m really excited to see where the science will take us, given the skills in the team. I hope I have been good enough at managing such a large and young team, but I have my doubts. A focus for 2025 for sure.
Data: This has been the year of big data, not necessarily just for ML purposes but also in the PolarRES project the production and management of an enormous set of future climate projections at very high resolution. More on this anon. Suffice to say, it has taken a lot of my time and mental energy and it’s probably not the most exciting thing to talk about, but we now have 800 Tb of climate simulation data to dig into. I suspect that rewards of this will be coming for years. There has also been a lot of digging into satellite datasets and the bringing together of the two has been very rewarding already. It’s a rich seam, to continue the metaphor, that will be producing scientific gold for many years.
Projects: we have gone in the final year of two projects, PROTECT and PolarRES, both of which will finally end in 2025. We also arrived at the half way point of OCEAN:ICE. So rather than being a year of starts, it has been a year where we have started to prepare for endings – actually this is a fun part of many projects where a lot of the grunt work is out the way and we can start to see what we have actually found out. It can also be a slog of confusing data, writing and editing papers and dealing with h co-author comments. I’ve definitely been in that process this year, hopefully with some of the outputs to come next year…
Proposals: I started 2024 writing a proposal. Colleagues were in 3 different consortia for the same call, alas ours didn’t get funded, but 2 of the others did and will start this year. That is a good result for DMI and our group. I wrote another proposal in the Autumn and contributed to a 4th and finally at the end of the year I heard that both will *likely* be funded (but are currently embargoed and in negotiation, so no more will be said now). It sometimes feels that spending so much time and energy on proposal writing is putting the cart before the horse, but in fact I find proposal writing something akin to brainstorming. It’s essential of course to ensure we can continue to do the science we want, but it can also help us to clarify our ideas and make sure we’re not on the wrong track. It’s also a good way to keep track of what the funders are actually wanting to know and to help us focus on policy relevance.
There was also an incredible number of meetings, reports, milestones and deliverables, but you probably don’t want to hear about that…
Also missing from this summary is personal life, and, well that is not for sharing publically, but suffice to say, I learnt about raising teenagers, I also had some very good times with friends and family, to all of whom I immensely grateful for being a part of my voyages around the sun.
Anyway, reading all that back, I’m not surprised I ended the year exhausted! I am not planning on quite such a slog in future. I should probably pace myself a bit more this year, the plans for which will be the subject of next week’s post.
This post is in response to a thread posted on blue sky* by Jeremy Bassis and a discussion between Felicity mcCormack and Gavin Schmidt. All these people are well-respected climate scientists and the original thread was posted as a result of a Nature piece about operationalising climate models (and sea level rise), like we forecast the weather. This is something I’ve been thinking about for a while too, as sea level rise is an undeniable existential threat to my home country…
Anyway, I replied with a link to the Danish Climate Atlas – which to my mind is very much a model for how climate information should be done. I can’t give a full overview of the Climate Atlas, largely because it’s not my story to tell, but as Jeremy asked me to talk more in depth about it, and given the 300 character limit, I thought I’d formulate a few thoughts here first before sharing…
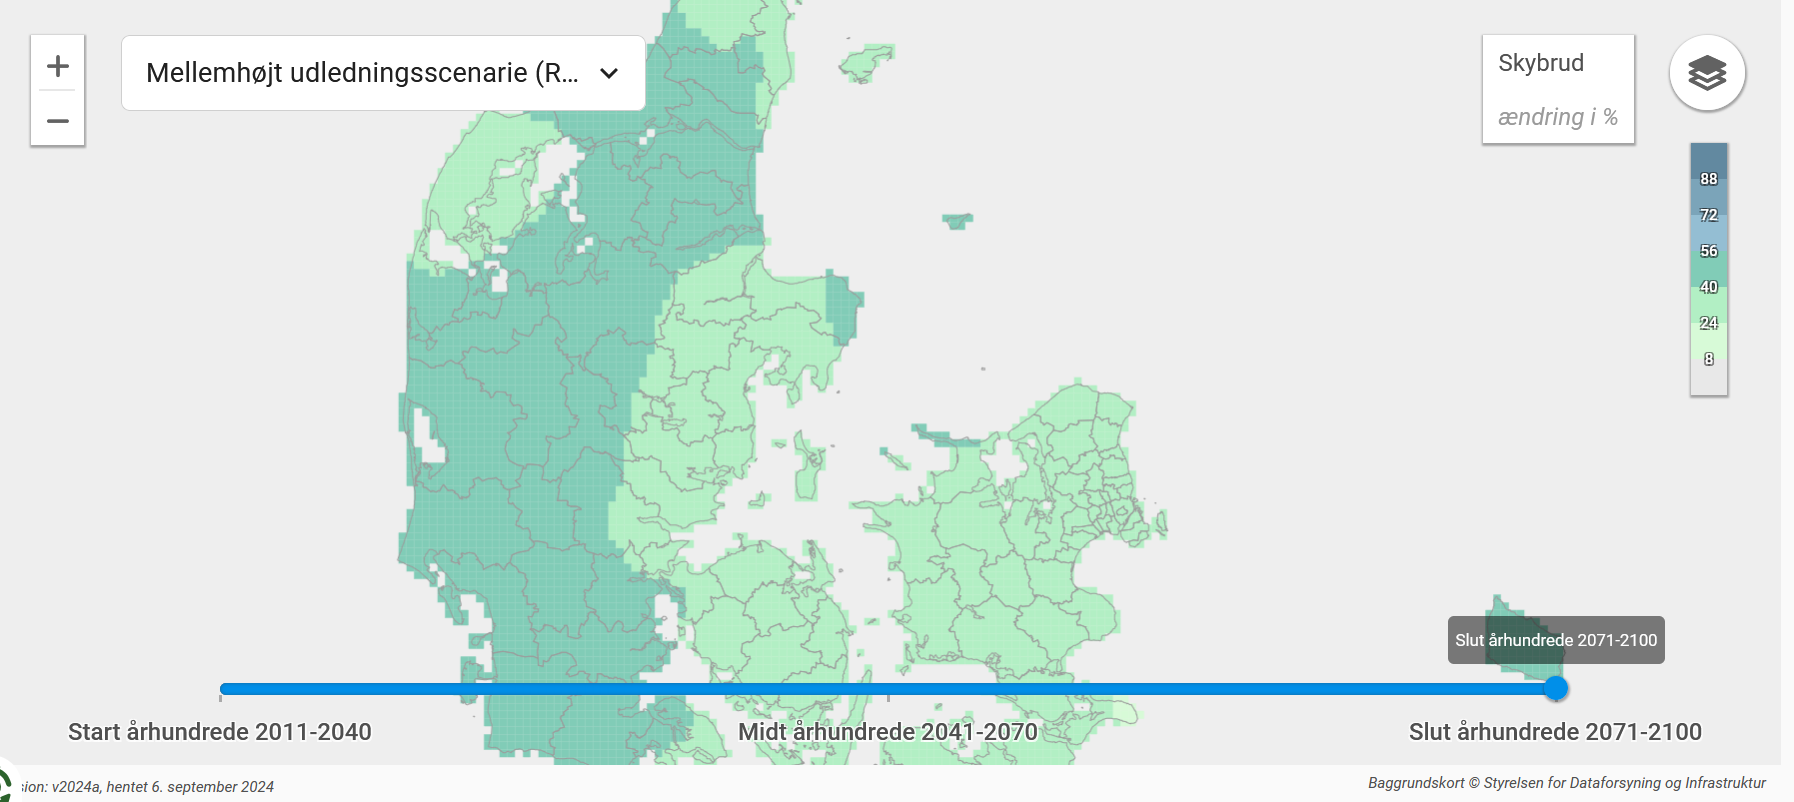
The climate atlas is not a book but a web frontpage that allows anyone with an internet connection to get high quality climate information at a local scale in Denmark. The map interface makes it easy and intuitive to use, and for detail a whole bunch of reports and datasets in different formats can be downloaded (everything from ASCII to GIS to netcdf). You can explore it here. All the data is given on a kommune (local authority) level except for sea level rise data which is divided up by coastal stretches.
Example of a Climate atlas figure – this is the overview figure, each local authority area is clickable for local information
For audiences that just want a quick message there are these easy to interpret icons with a key message below, like this one about higher water levels.
I was involved in the early stages and to my mind there are 4 crucial elements that have made it very successful:
Legal Requirement: Every local authority (a kommune, don’t think hippies, think regional councils) in Denmark has a legal obligation to make climate adaptation plans and to keep them updated. This element is important as it created awareness of the problem and effects of climate change and the necessity of investigating adaptation options. The initial plans were rather patchy and not very consistent with each other. Many regions had employed a consultant who was also maybe not an expert. Several kommune ended up with data based on CMIP resolution data! Hardly appropriate for a small local region in Denmark (which is barely resolved in most global climate models).
Data Foundation: At the same time we have been dynamically downscaling these simulations for decades, to provide really high quality locally bias corrected data (using also DMI’s long climatological time series to understand if and where biases exist). Colleagues at DMI identified a need to provide this in an easy to use format to everyone in the country. We had long ago discovered that working with motivated kommune employees led to a really good outcome: readable climate variables that are meaningful to an individual city, data formats that can be used by non-scienists (who definitely can’t deal with netCDFs).
Funding: Doing a data project properly requires money. The Climate Atlas is, compared to the cost of not doing anything, extremely cheap, nonetheless, it still costs something. Ear marked funding from the danish state to build up the Climate Atlas from the ground, to develop it as new needs are identified and to improve both communication and presentation has been crucial. Along the way several different needs have arisen (droughts, deep uncertainty in sea level rise), a new version will hopefully be coming soon.
Intense engagement: Probably the most crucial aspect to getting the climate atlas off the ground and into use has been communication over and over and over again. Not just initially with kommune to find out what they need (building on many years of background experience first), but also reaching out to special interest groups raning from local farmers in mid-west Jylland to sewage engineers, high school teachers and property developers. This continues, but has undeniably been helped by Denmark’s open trusting society and generous tradition of cultural meetings, continuing education and festivals.
The climate atlas in Denmark is the example I know best, we should be rightly proud of the team that constructed, maintain and continue to develop it. Other countries certainly have similar products in the Nordic and Blatic countries, and likely elsewhere, a network meets annually within the region to discuss developments etc. After a coincidental meeting, DMI was also invited to help develop one for Ghana, which is ongoing, and of course, will have completely different needs and requirements, However, the decision early one to base the back end of the Climate Atlas on open tools: python, cdo, github and CORDEX simulations, makes a lot of the learnings transferable.
If you want to know more, contact my colleagues at the Klima Atlas! I’m happy to put you in touch..
*As an aside, it’s interesting how many of the climate science and policy community have moved over to Blue Sky. It was rather quiet for a while but activity seems to have picked up. I’m not abandoning mastodon, which I actually prefer, but I’m happy to see an alternative to what has become known as Birdchan. I’d urge you to try it if you’re interested in a social media presence in a slightly more appealing environment. There are a number of handy tools, including fedica, that allow you to crosspost to multiple channels at the same time (including X, mastodon, bsky, TikTok and threads) and I’m also using the OpenVibe app, which has a common timeline from multiple platforms.
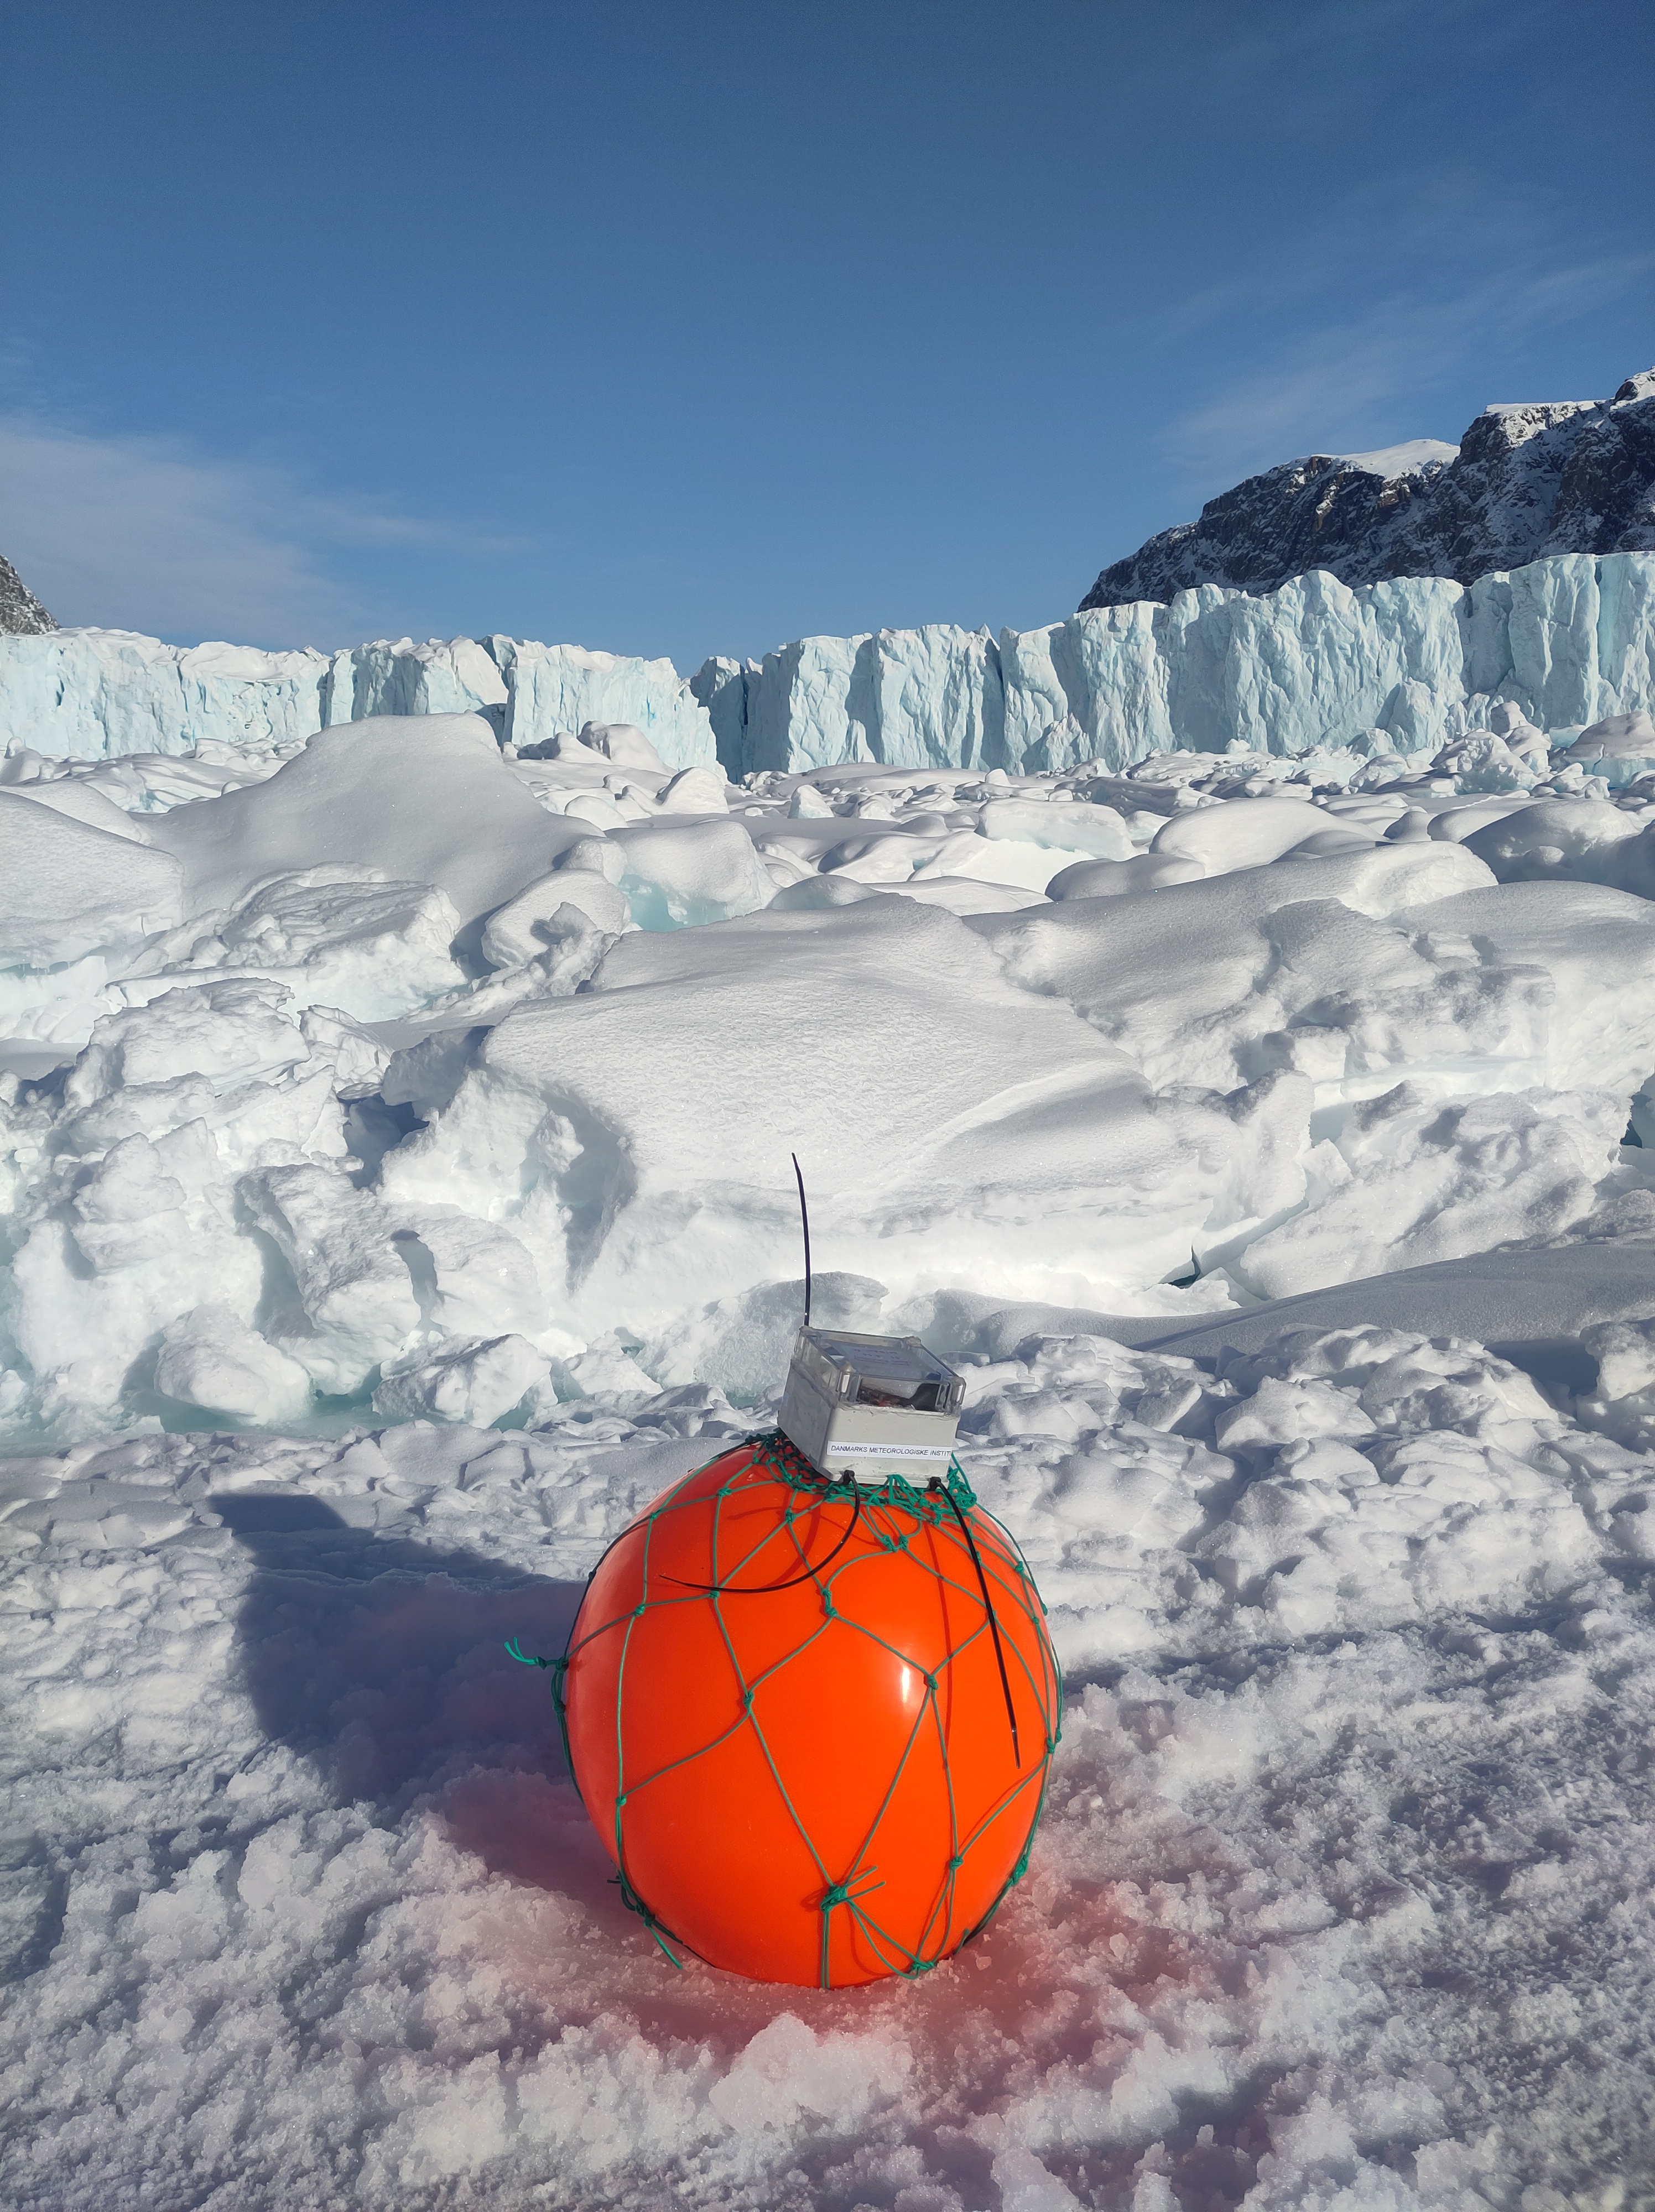
Way back in the mists of time, that is, early April, I and colleagues deployed some instruments on the sea ice in front of a number of glaciers in Northern Greenland, which I wrote a little bit about here.
Trusted global GPS tracker buoy
Open met buoy
Since then I’ve mostly been letting them get on with reporting their data back and occasionally checking on the satellite imagery to see how it’s looking in their surroundings.
It was about -30C and very cold when I left them out, so it’s sometimes quite hard to visualise just how much things will change over only a few months and to remember that at some point, they’ll need collecting
After a fairly melty start (yes, that is actually a technical term) to July, particularly in the northern part of the ice sheet (which you can see on the polarportal, see also below right) it’s time to start anticipating their collection.
We have a lot of advantages when it comes to coordinating this kind of project now, compared to the bad old days when imagery and communication were both scarce and expensive
For starters, there is Sentinel Hub’s EO browser, a course in which should be a requirement for every earth science adjacent subject in my opinion. EO Browser produces superb pre-processed imagery for free, such as this one, from the European Space Agency’s Sentinel-2 satellite yesterday
As you can see, the sea ice is still there but fracturing and patches of open water (in blue green) are now becoming visible.
Sentinel 2 satellite image processed on EO browser showing sea ice and ice bergs in front of Tracy and Farquhar glaciers.
If you’re out and about and only have your phone, there is also the excellent snapplanet.io app on your smartphone, with which you can create instagram ready snapshots of the planet or even animated gifs, with high resolution imagery a link away…
Now that’s what I call a fun social media* application…
Animated gif of satellite images showing the front of Heilprin glacier with icebergs and landfast sea ice.
Anyway, back to the break up. Every year, the sea ice forms in the fjord from October/November onwards, by December it’s often thick enough to travel on and then from April it starts to thin and melt and by late June large cracks are starting to form, allowing the surface meltwater to drain through. For a look at what happens if you get a large amount of melt from, say, a foehn wind, before the cracks start to open up, see this iconic photo taken by my colleague Steffen Olsen in 2019.
An extremely rare event, that nevertheless went viral
The other advantage we have working in this fjord is our collaboration with the local hunters and fishers. In winter they use dog sleds for hunting and accessing fishing sites, and to take us and our equipment out on to the ice. In summer, they are primarily using boats for fishing, hunting narwhal and, hopefully, collecting our equipment! Our brilliant DMI colleague Aksel who lives and works in the local settlement is also a huge help in assisting with communication and generally being able to get hold of things and people when asked.
Winter travel
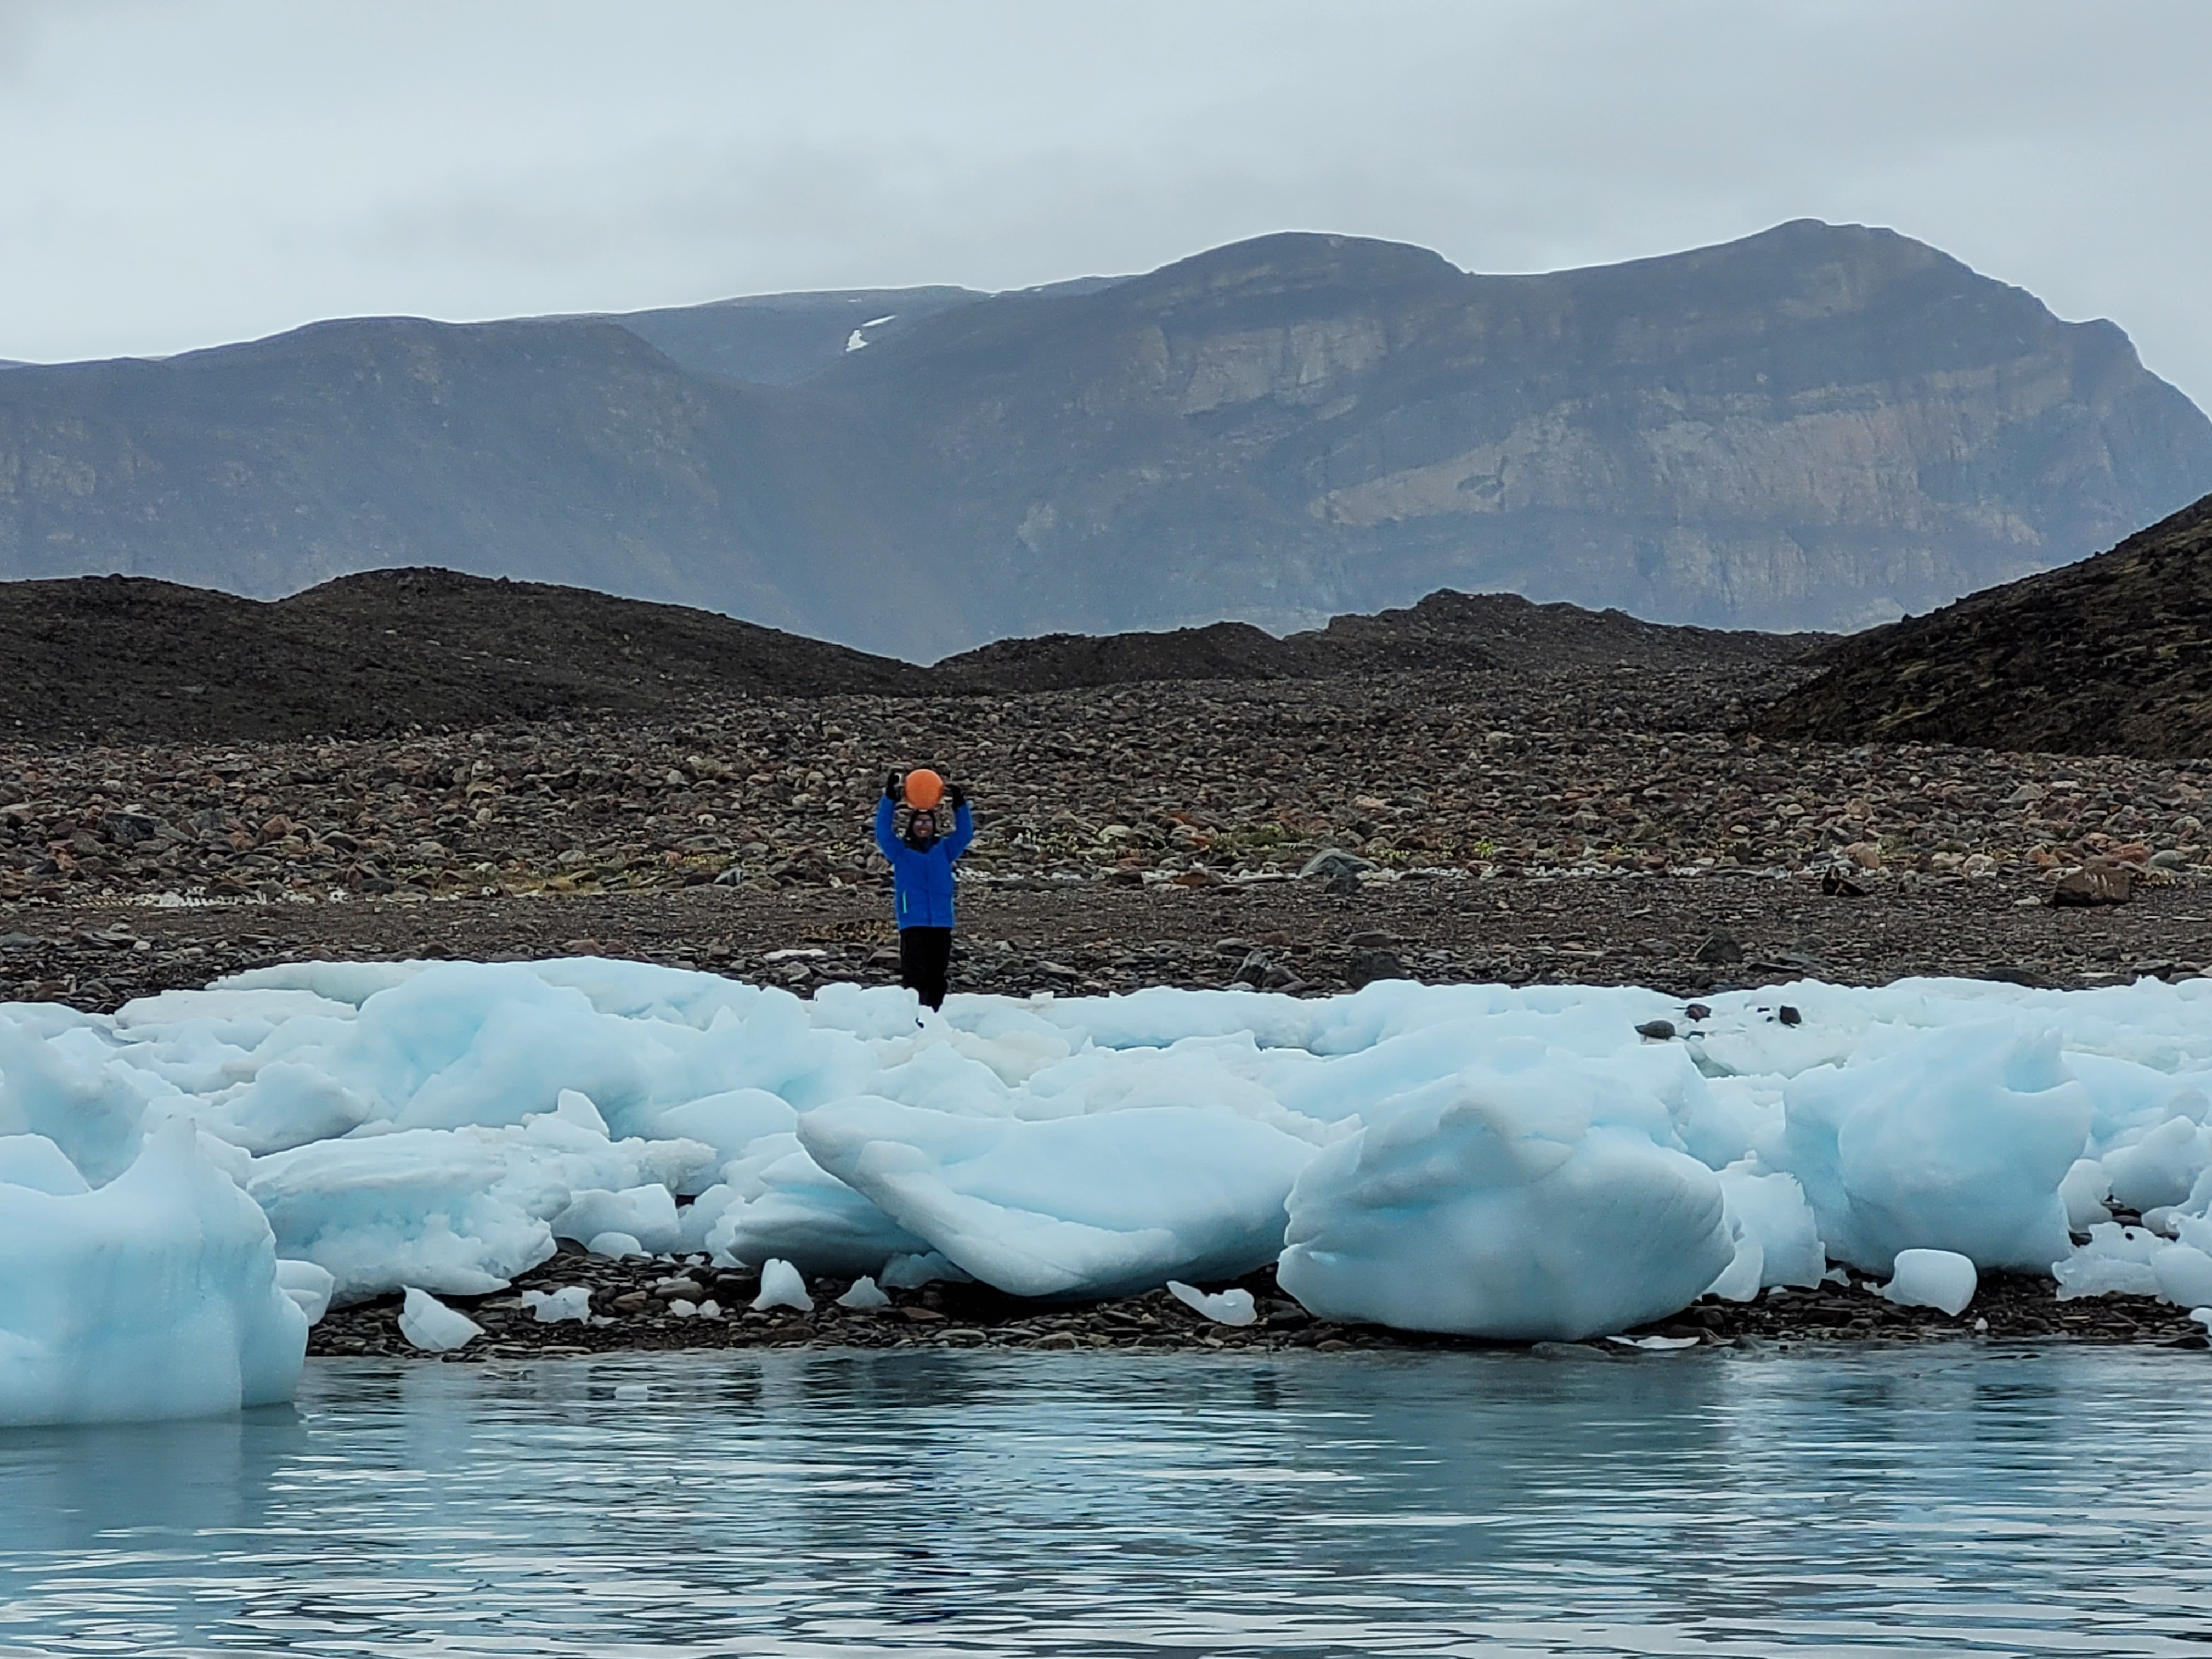
We offer a reward for each buoy that is found and brought back to our base in Qaanaaq, so many of them in fact make their own way home. But we also work with our friends on a kind of remote treasure hunt, challenge Anneka style, with someone at home watching their positions come in via the satellite transmissions and sending updated information via sms to an iridium phone to the hunters on the boat…
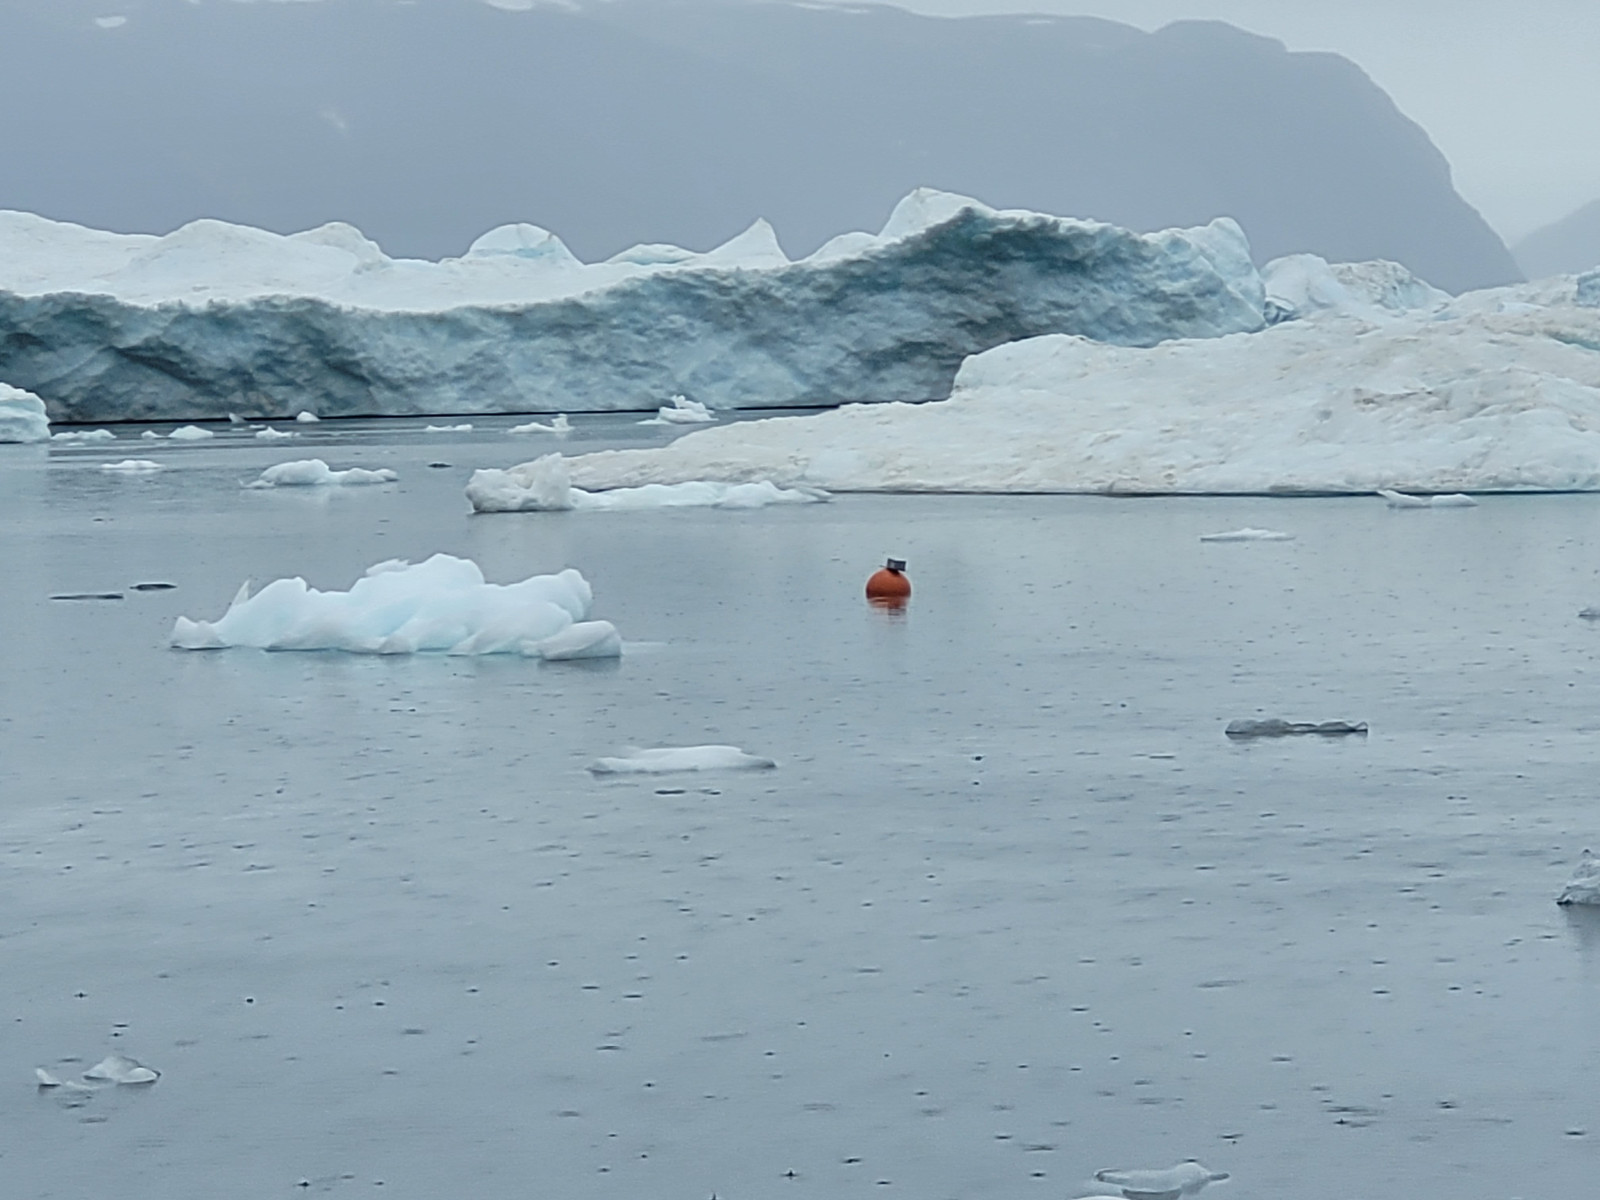
I’m told it’s tremendous fun, with sharp eyes required, as even a bright orange plastic globe can be challenging to spot.
A floating trusted buoy in 2022.
I’ve never participated in this treasure hunt myself sadly, on land we generally see something like a spaghetti of arrows and spots via the Trusted global web api:
GPS positions from a trusted buoy.
We then have to try and superimpose these movements on the latest satellite images to work out if the buoy is floating or not, and then check to see if there is sufficient open water for a collection. Naturally working with local knowledge for this part is also absolutely vital.
One of our buoys is found…
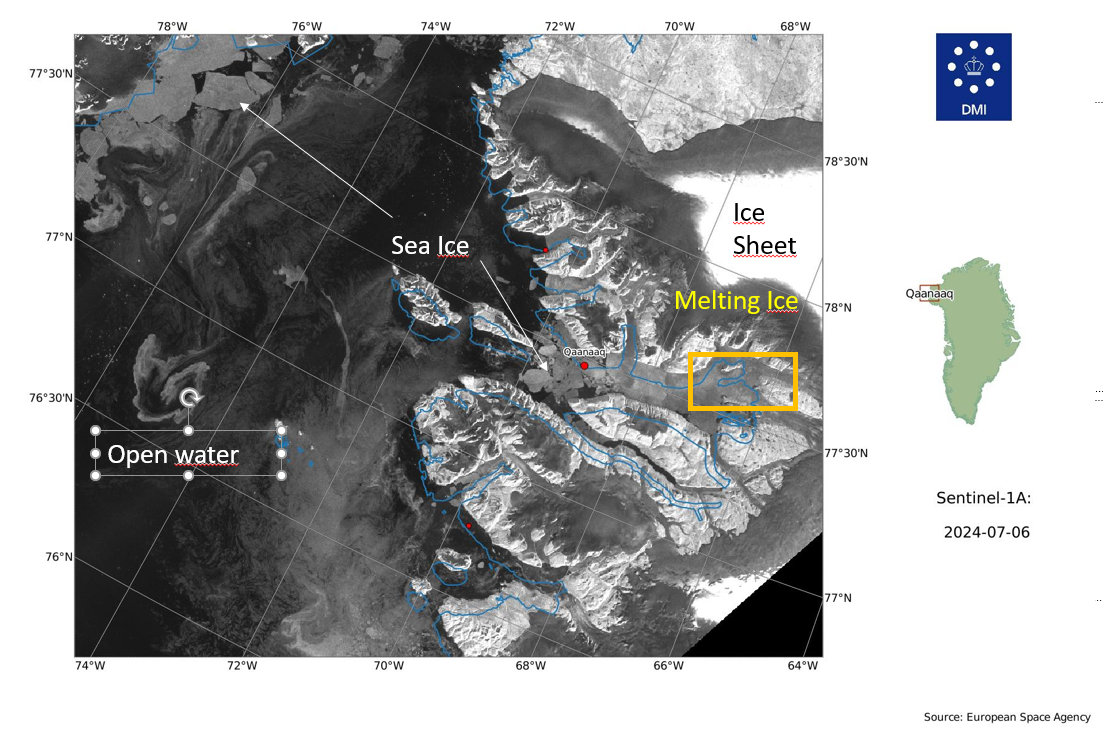
The latest satellite images look like the ice has already broken up into large flakes close to Qaanaaq. I’ve annotated the Sentinel-1 image below as it is from a radar satellite that can see through clouds and the images can be a bit confusing if you’re not used to looking at them.
The scale of the massive melt on the ice sheet from the last few days is clearly visible in the dark grey rim on the glaciers. The open sea water is black and the sea ice shows up as geometric greys. This one is downloaded from the automatic archive my colleagues at DMI maintain around the whole coast of Greenland. It can be a handy quick check too.
Annotated satellite image of Kangerlussuaq/Inglefield Bredning (Gulf of Inglefield) fjord. The orange box shows where our study glaciers are located.
So, although the ice is starting to break up it’s at the tricky stage where it’s far from navigable by dog sled and certainly too difficult for boats, so it’s not quite the time to send out hunting parties for GNSS buoys.
It also means that when I go on holiday next week, I will not be quite leaving all this behind. I and my colleague in this project will be monitoring the movements of the buoys and the satellite pictures, as well as relying on our friends in the local community to let us know how the ice is looking and if they can get out to rescue our brave little sensors.
In the mean time I have plenty of data to start analysing and writing up. As ever massive thanks to the people of Qaanaaq and my cool colleagues for putting up with me and our GPS buoys. We hope to submit our first paper pretty soon..
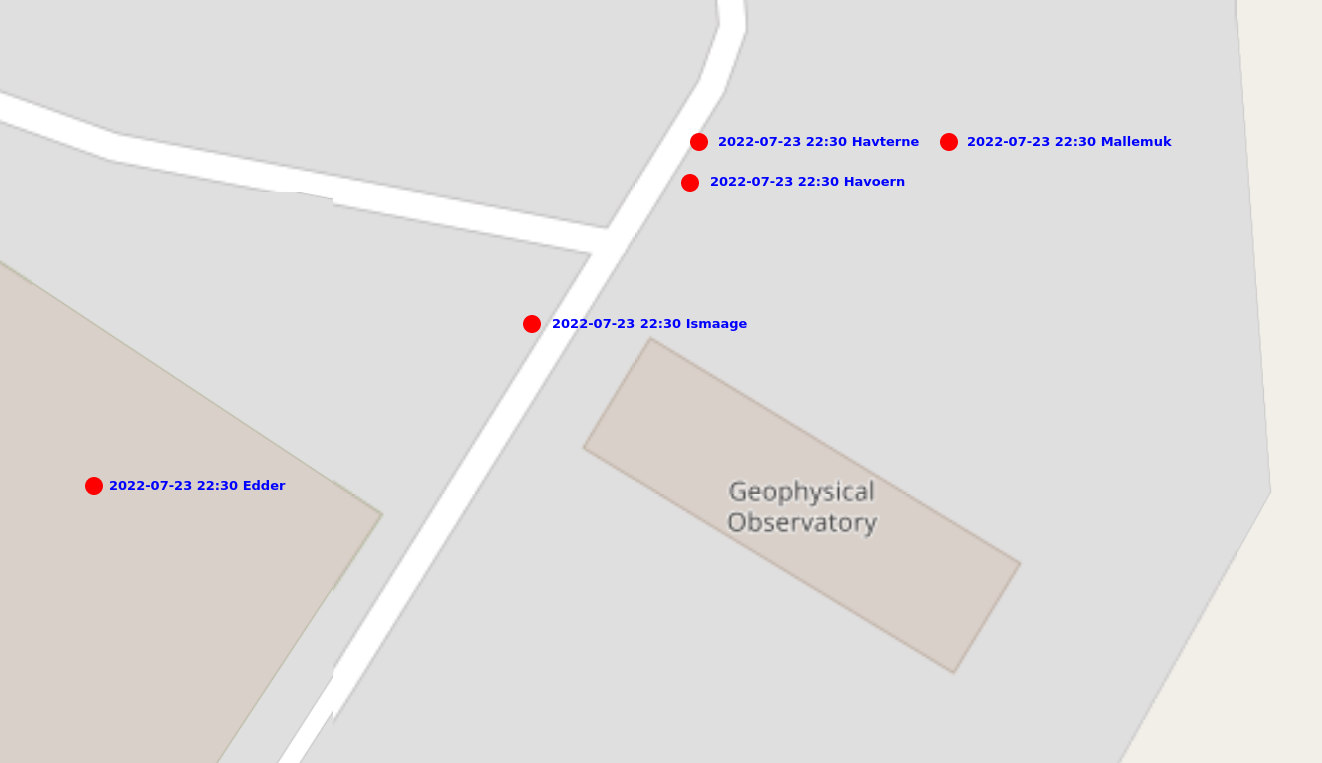
Hopefully I’ll soon be able to look at a map like this one to see where they are (note that the precision on these buoy positions isn’t great, probabaly because they were thenbeing stored in a metal container).
*Yes, I’m probably a nerd. I’m a lot of fun** at parties too though.
I’m lifting my head from the semi-organised chaos that is my office, my home office, our family basement and the office workshop to write a quick post. This might be for reasons of despairing procrastination.
The reason for the chaos is that fieldwork season has come round again and on Friday I and my DMI colleague Steffen will be off to Northern Greenland once again. I’ll try to post a few photos to pixelfed (and perhaps even Instagram, though I swore off Meta products after the Brexit fiasco).
This year my focus is again on the melange zone and we’ll be placing our instruments out to record the break-up of the fast ice. I also hope to get time to establish a new snow measurement programme – which I partly piloted last year. However, we will only be 2 scientists instead of the team of 4 this year, so this may have to wait until the second fieldwork period we have planned in early June (when the sea ice starts to break up). We are fortunate indeed that the local hunters, who still live a semi-subsistence lifestyle, are both incredibly competent and helpful and willing and eager to help when we go out on fieldwork.
Last year was a test of concept, and noone was more astonished than I was that the final set up not only survived the ice break up and floated safely down the fjord, we also managed to retrieve them and I hope they are waiting patiently in Qaanaaq so I can reprogramme and redeploy this year.
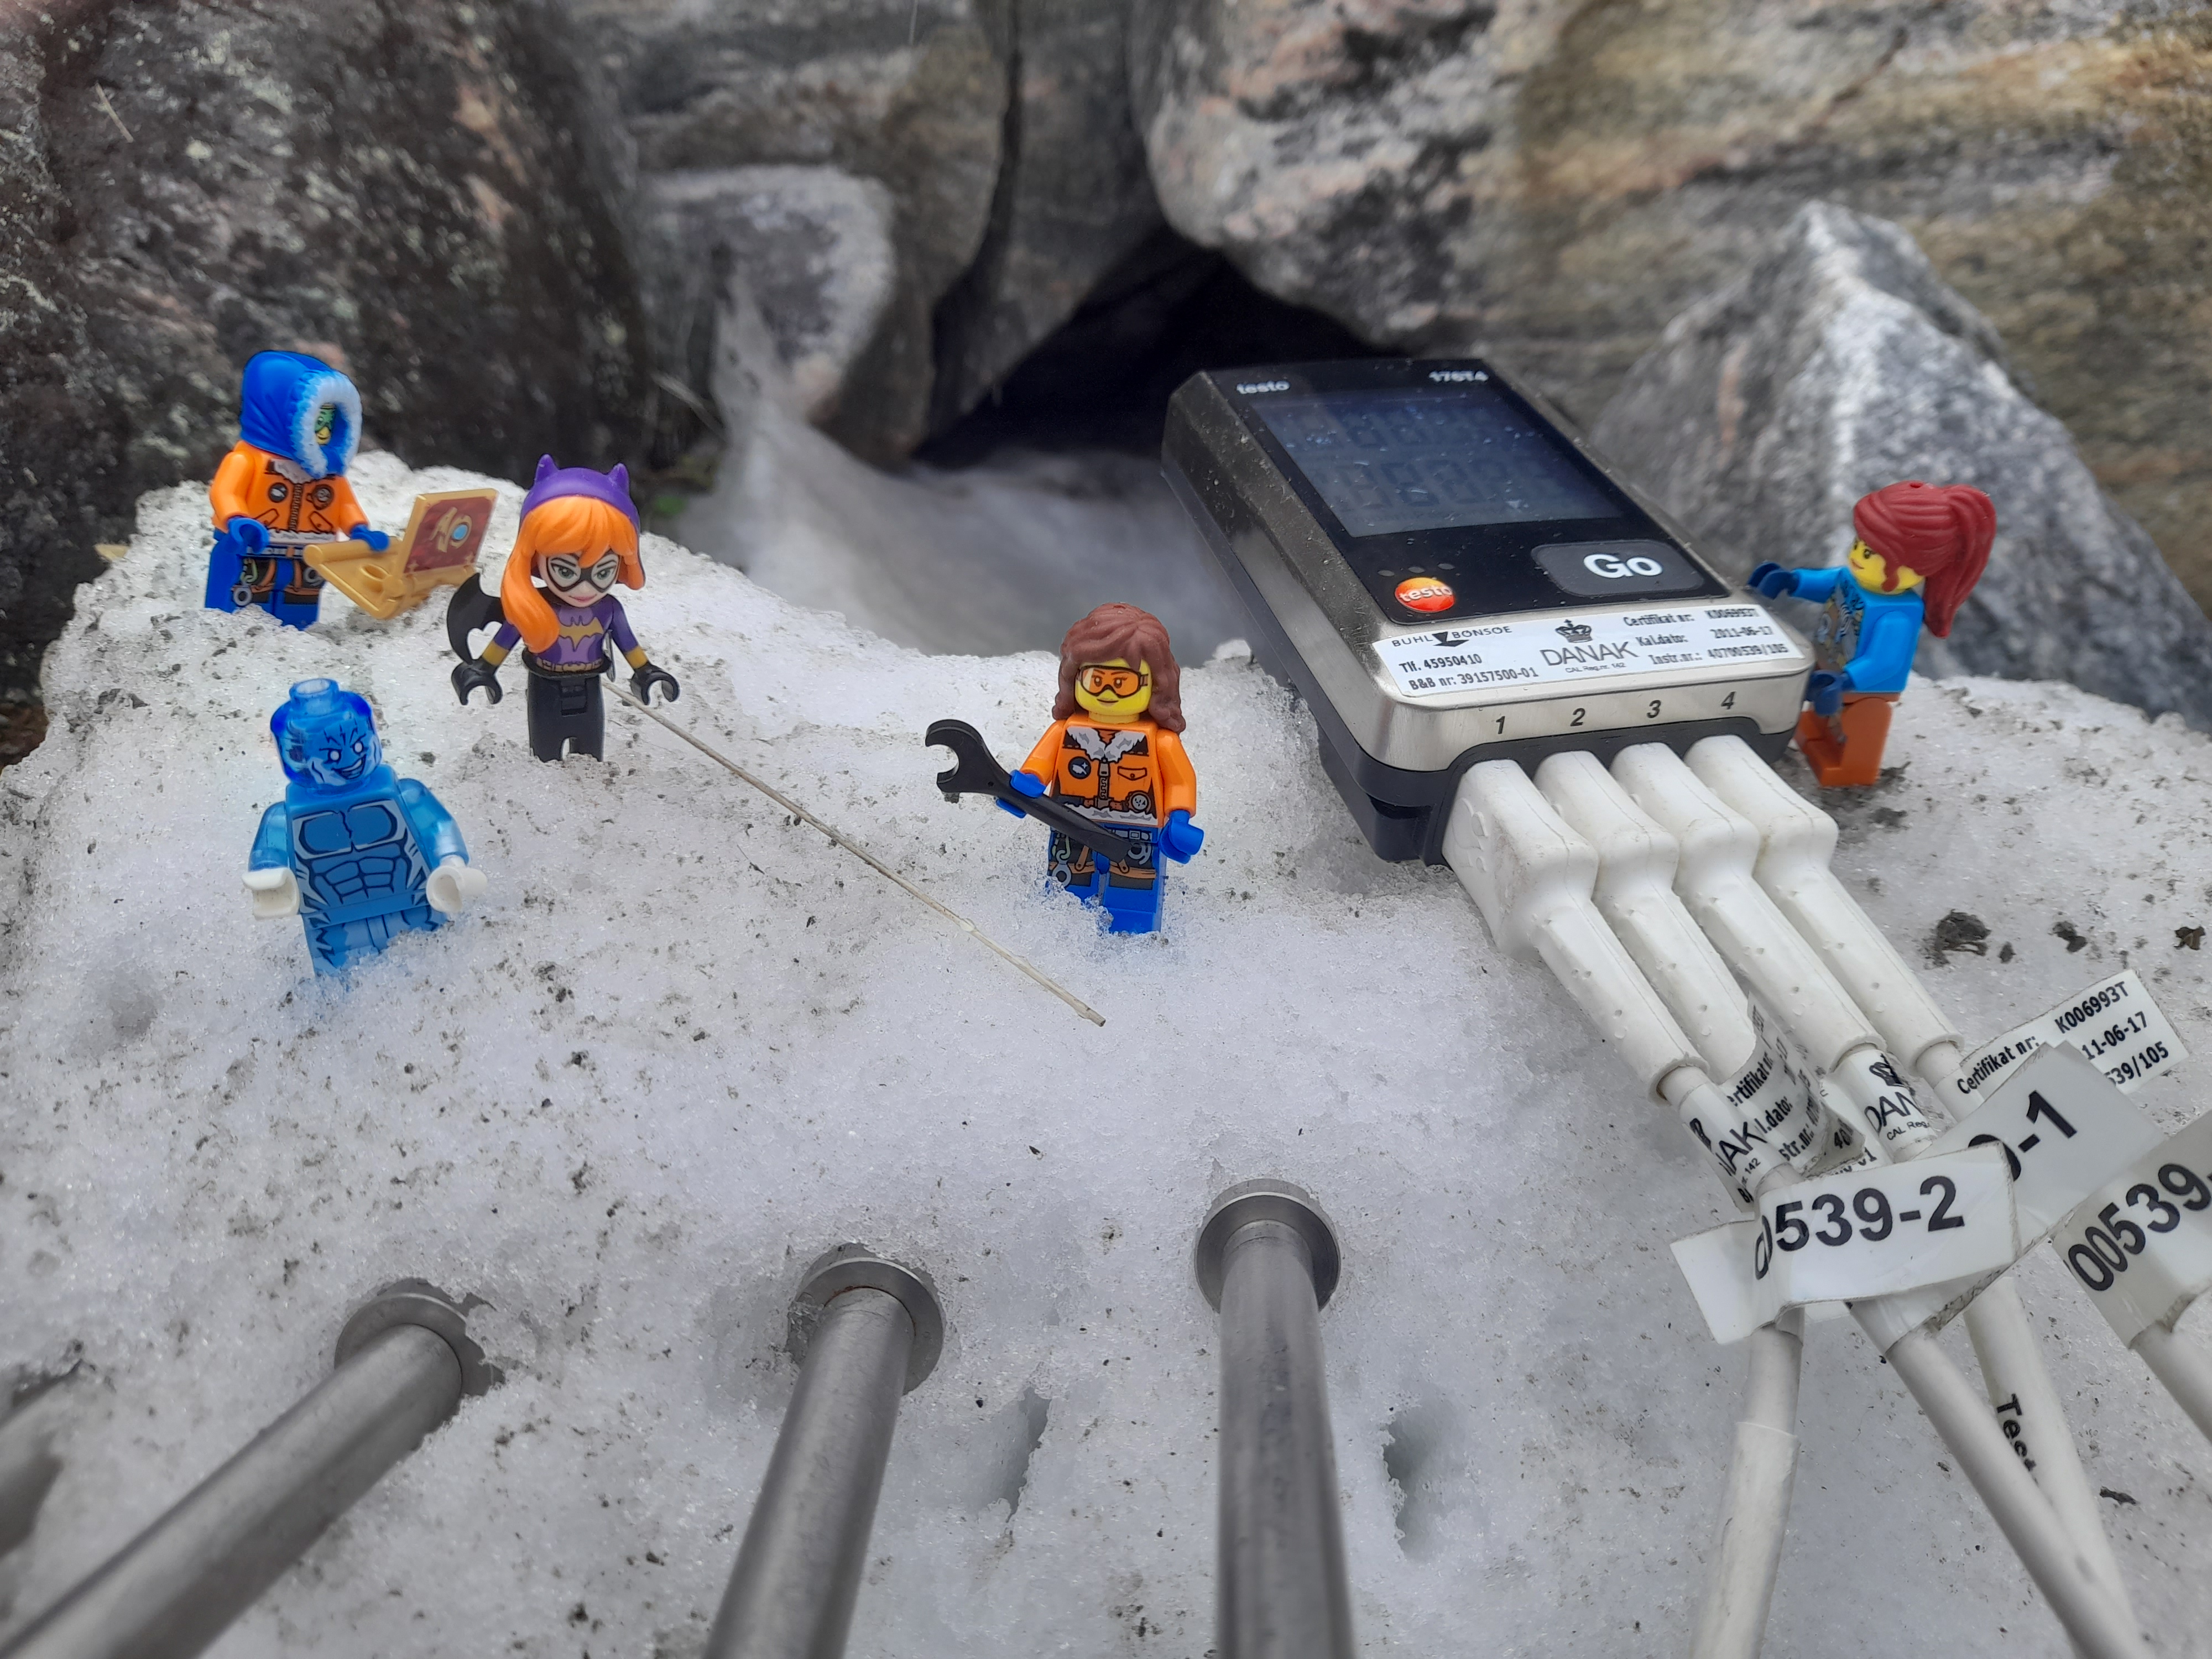
I wrote this piece on our work last year, promising a whole load of posts I didn’t end up having time to write. Sadly even my lego scientists never got an update. So instead of promising a whole lot of new posts, let me know what you’d like to see and read about either in the comments here or on my mastodon feed, and I’ll try to make some time to answer one or two of them while we go.
The area we travel to is going through very rapid changes now – not just climatic and environmental, but, perhaps even higher impact, social and cultural. I am privileged to be abel to witness it and we try hard to leave as little impact as possible.
At this stage it’s hard to imagine I’ll ever be ready to leave, but the clock is ticking down..
UPDATE THE MORNING AFTER (21/10/2023): water levels are now falling rapidly to normal and the worst of the gales are past, so it’s time for the clean-up and to take stock of what worked and where it went wrong. It’s quite clear that we had a hundred year storm flood event in many regions, though the official body that determines this has not yet announced it. Their judgement is important as it will trigger emergency financial help with the cost of the clean-up.
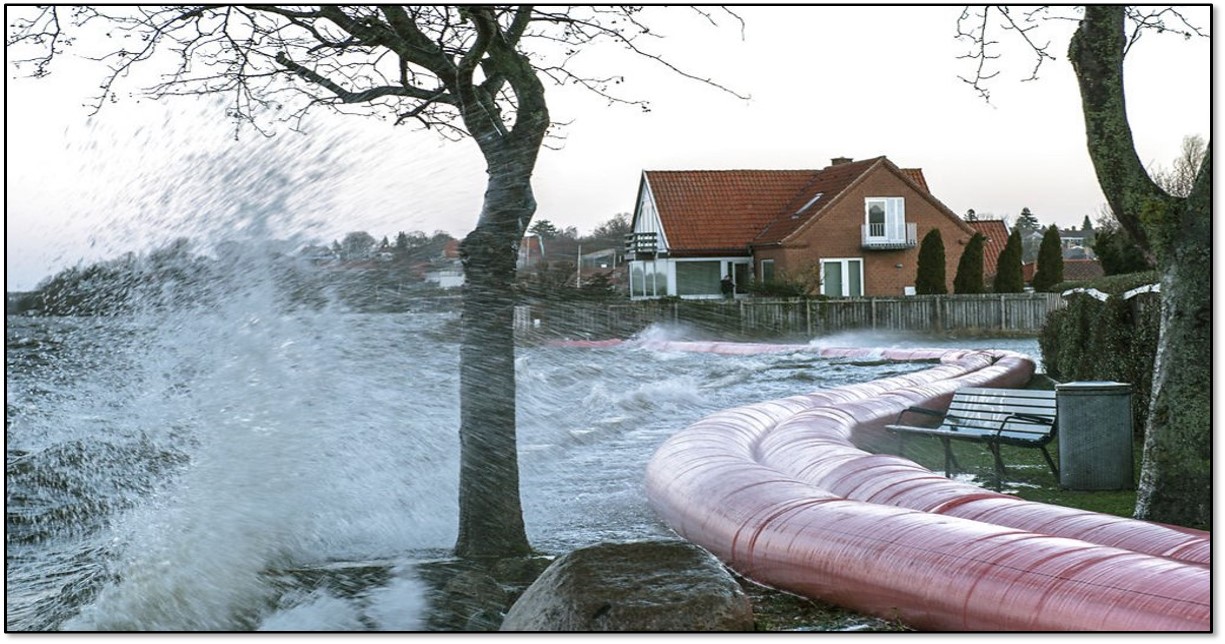
In most places the dikes, sandbags and barriers mostly worked to keep water out, but in a few places they could not deal with the water and temporary dikes (filled pvc tubes of water km long in some cases) actually burst under the pressure, emergency sluice gates and pumps could also not withstand the pressure in one or two places.
Trains and ferries were delayed or cancelled and a large ship broke free from the quayside at Frederikshavn and is still to be shepherded back into place.
Public broadcaster DR has a good overview of the worst affected places here.
Water levels reached well over 2m in multiple places around the Danish coast and in some places, water measurements actually failed during the storm..
In other places, measurements show clearly that the waters are pretty rapidly declining. So. A foretaste of the future perhaps? We will expect to see more of these “100 year flood” events happening, not because we will have more storms necessarily but because of the background sea level rising. It has already risen 20cm since 1900, 10cm of that was since 1991, the last few years global mean sea level has risen around 4 – 4.5 mm per year. The smart thing to do is to learn from this flood to prepare better for the next one.
But we as a society also to assess how we handle it when a “hundred year” flood happens every other year…
-Fin-
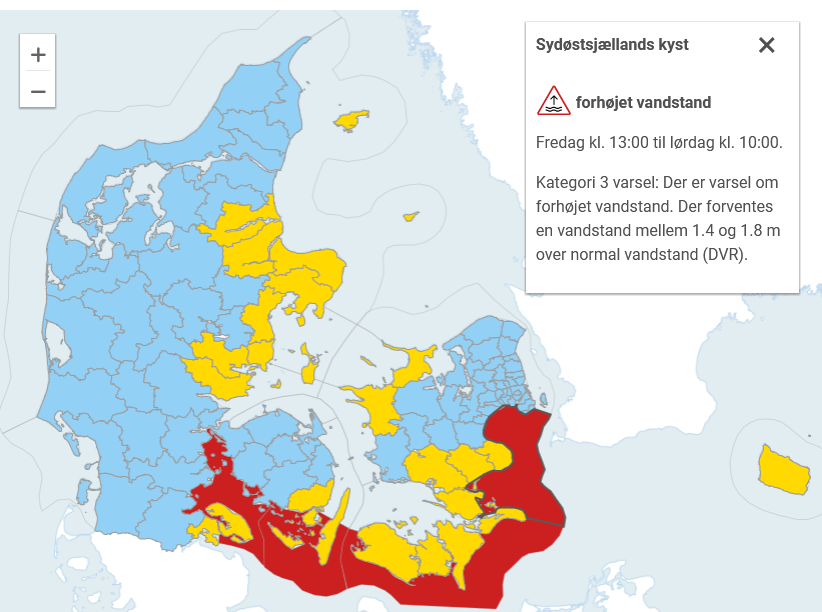
Like much of northern Europe we have been battening down the hatches, almost literally, against storm Babet in Denmark this week. DMI have issued a rare red weather warning for southern Denmark, including the area I often go kayaking in.
Weather warning issued by DMI 20th October 2023 There are three levels, blue signifies the lowest, yellow is medium and the highest is red, which is rather rarely issued. The boxed text applies to the red zome around southern Denmark and states it relates to a water level of between 1.4 and 1.8m above the usual.
I should probably start by saying that this storm is not caused by climate change, though of course in a warming atmosphere, it is likely to have been intensified by it, and the higher the sea level rises on average, the more destructive a storm surge becomes, and the more frequent the return period!
Neither are storm surges unknown in Denmark -there is a whole interesting history to be written there, not least because the great storm of 1872 brought a huge storm surge to eastern Denmark and probably led directly to the founding of my employer, the Danish Meterological Institute. My brilliant DMI colleague Martin Stendel persuasively argues that the current storm surge event is very similar to the 1872 event in fact, suggesting that maybe we have learnt something in the last 150 years…
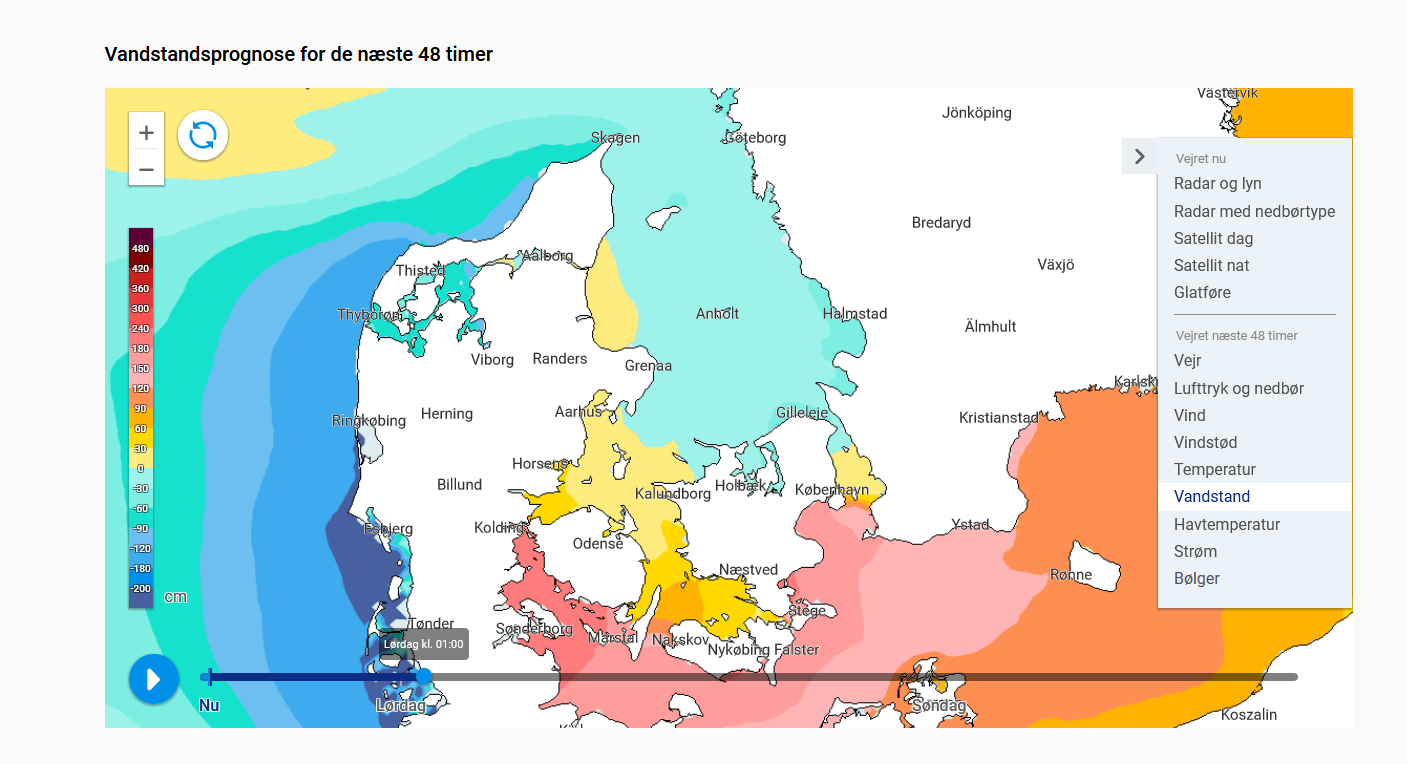
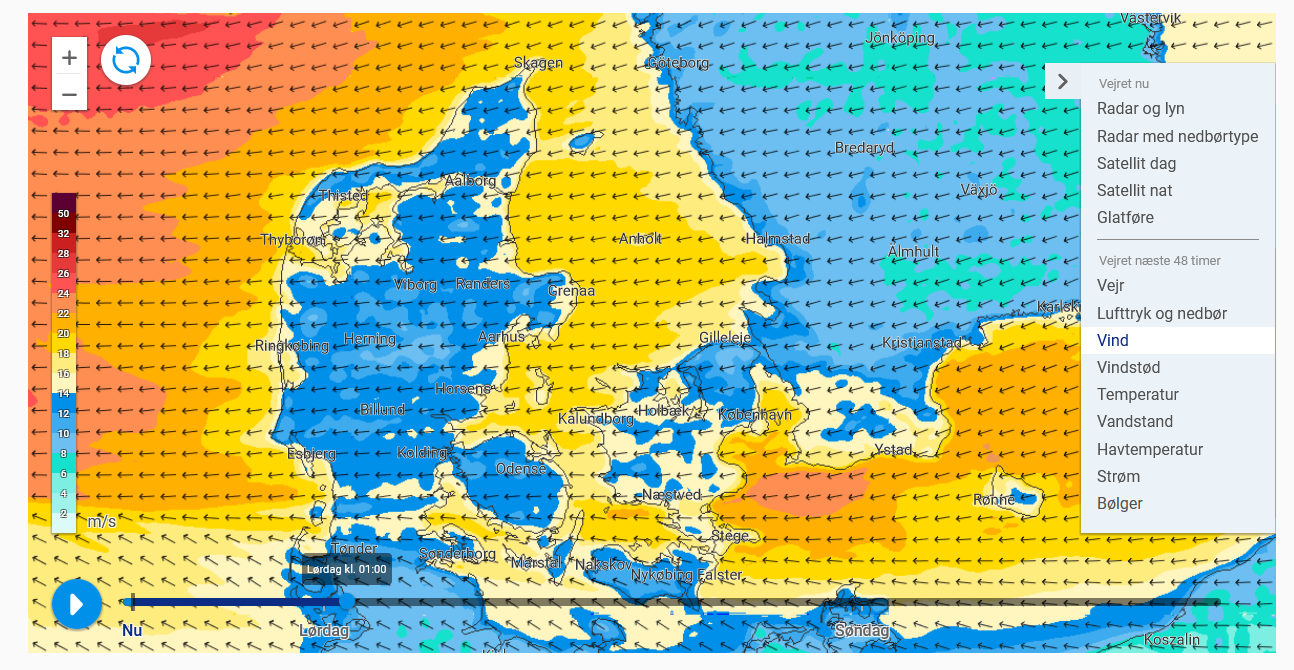
However, back to today: the peak water is expected tonight, and the reason why storm surges affect southern and eastern Denmark differently to western Denmark is pretty clear in the prognosis shown below for water height (top produced by my brilliant colleagues in the storm surge forecasting section naturally) and winds (bottom, produced by my other brilliant colleagues in numerical weather prediction):
Basically, the strong westerly winds associated with the storm pushed a large amount of water from the North Sea through the Kattegat and past the Danish islands into the Baltic Sea over the last few days. Imagine the Baltic is a bath tub, if you push the water one way it will then flow back again when you stop pushing. Which is exactly what it is now doing, but now, it is also pushed by strong winds from the east as shown in the forecast shown above. These water is being driven even higher against the coasts of the southern and eastern danish islands.
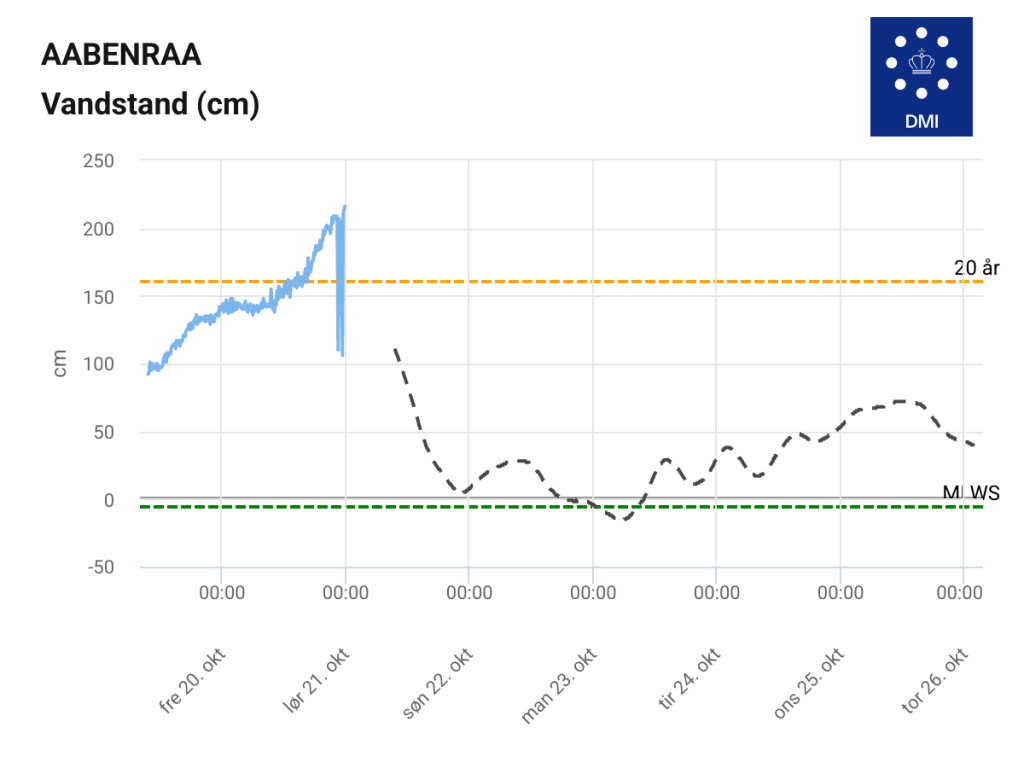
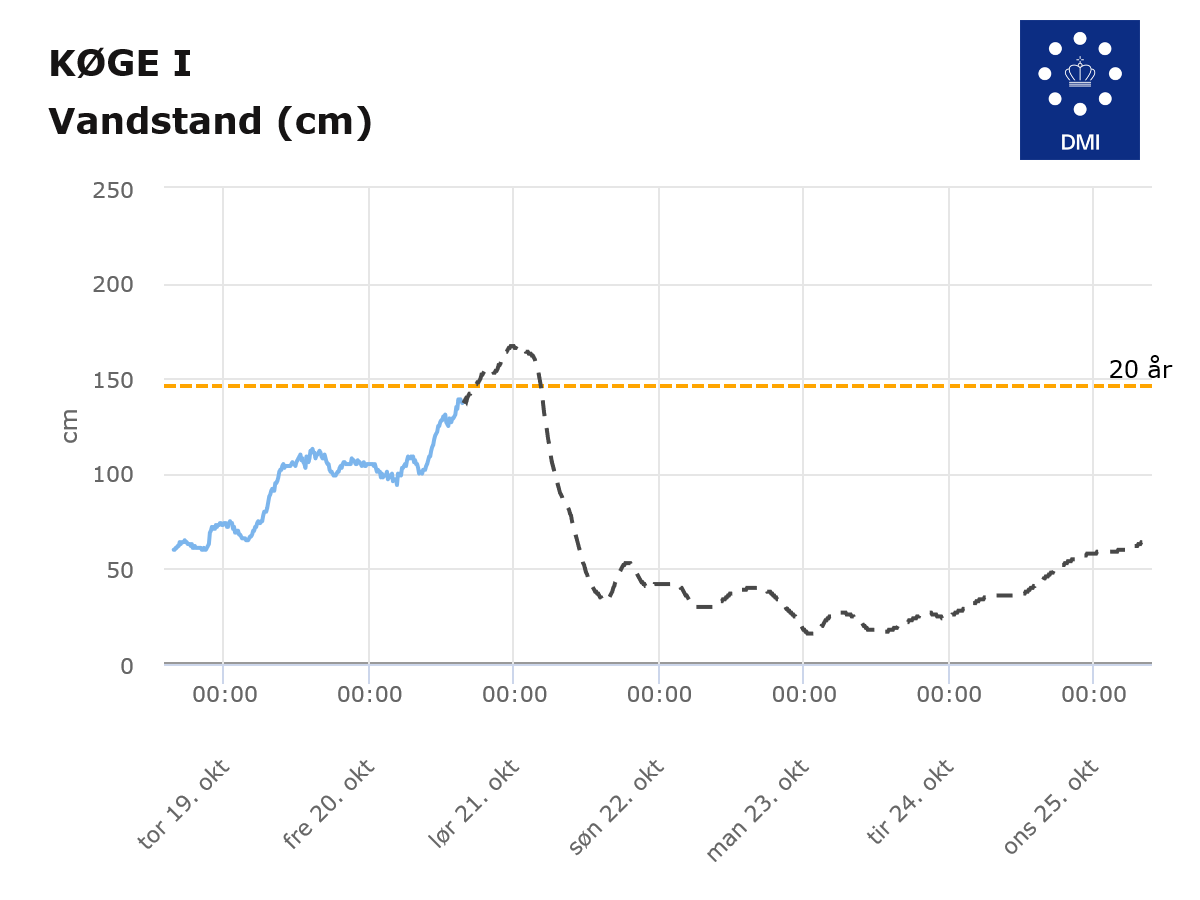
These kind of storm surges are sometimes known as silent storm surges by my colleagues in the forecasting department because they often occur after the full fury of the storm has passed. I wrote about one tangentially in 2017. This time, adding to the chaos, are those gale force easterly winds, forecast to be 20 – 23 m/s, or gale force 9 on the Beaufort Scale if you prefer old money, which will certainly bring big waves that are even more problematic to deal with that a slowly rising sea, AND torrential rain. So while the charts on dmi.dk which allow us to follow the rising seas (see below for a screengrab of a tide gauge in an area I know fairly well from the sea side), water companies, coastal defences and municipalities also need to prepare for large amounts of rain, that rivers and streams will struggle to evacuate.
Water height forecast for Køge a town in Eastern Sjælland not far from Copenhagen. The yellow line indicates the 20 year return period for this height. Blue line shows measurements and dashed black lines show the forecast from the DMI ocean model. You can find more observations here.
In Køge the local utilities company is asking people to avoid running washing machines, dishwashers and to avoid flushing toilets over night where possible to avoid overwhelming sewage works when the storm and the rain is at the maximum.
This brings me to the main lessons that I think we can learn from this weather (perhaps super-charged by climate) event.
Firstly, it’s the value of preparedness, and learning from past events. There will certainly be damage from this event, thanks to previous events, we have a system of dykes and other defence measures in place to minimse that damage and we know where the biggest impacts are likely to be.
Secondly, the miracle, or quiet revolution if you will, of weather and storm forecasting means we can prepare for these events days before they happen, allowing the deployment of temporary barrages, evacuations and the stopping of electricity and other services before they become a problem.
This is even more important for the 3rd lesson, that weather emergencies rarely happen alone – it’s the compound nature of these events that makes them challenging – not just rising seas but also winds and heavy rain. And local conditions matter – water levels in western Denmark are frequently higher, the region is much more tidally influenced than the eastern Danish waters. This is basically another way of saying that risk is about hazard and vulnerability.
Finally, there are the behavioural measures that mean people can mitigate the worst impacts by changing how they behave when disaster strikes. Of course, this stuff doesn’t happen by itself. It requires the slightly dull but worthy services to be in place, for different agencies to communicate with each other and for a bit of financial head room so far-sighted agencies can invest in measures “just in case”. We are fortunate indeed that municipalities have a legal obligation to prepare for climate change and that local utilities are mostly locally owned on a cooporative like basis – rather than having to be profit-making enterprises for large shareholders..
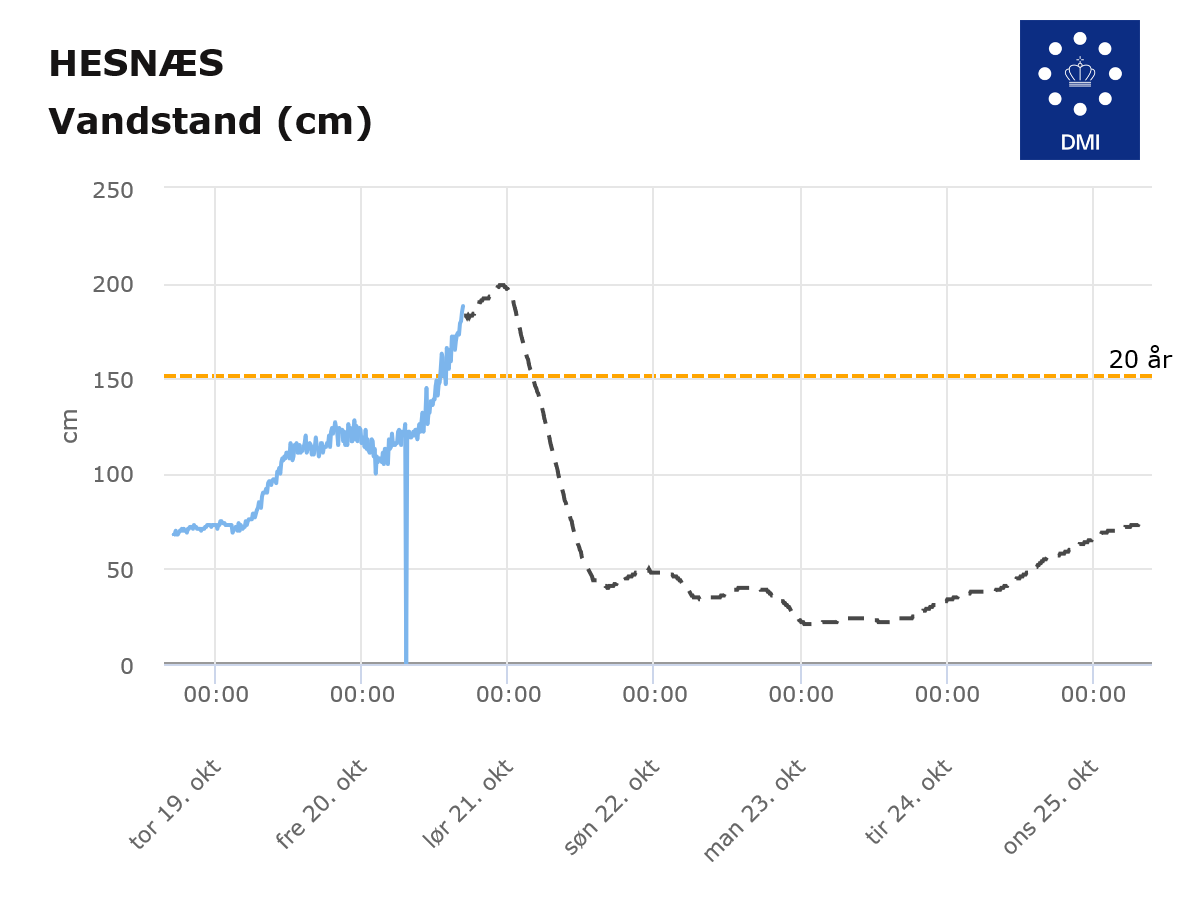
This piece is already too long, but there is one more aspect to consider. The harbour at Hesnæe Havn has just recorded a 100 year event, that is a storm surge like this would be expected to occur once ever hundred years, in this case the water is now 188cm. The previous record of 170cm was set in 2017. We need to prepare for rising seas and the economic costs they will bring. The sea will slowly eat away at Denmark’s coasts, but the frequency of storm surges is going to change – 20cm of sea level rise can turn a 100 year return event into a 20 year return event and a 20 year return event into an ever year event.
Screenshot of the observations of sea level from Hesnæs
We need to start having the conversation NOW about how we’re going to handle that disruption to our coastlines and towns.
We are expanding quite rapidly at DMI currently – part of a strategic plan to ensure that we are primed for a generational shift at DMI, but also reflecting some of the themes I touched on yesterday – an expansion into climate services and the development of new machine learning based models and advanced statistical techniques for weather and climaet applications. Note also that the remote sensing part of NCKF
UPDATE: A new position advert has been added:
0) Climate Scientist with Focus on Decadal Climate Prediction
Our sister units also have some interesting postings out that would also crossover with the work we do in our section on the climate of Denmark and Greenland.
4) Remote sensing and/or machine learning specialist for automated sea ice classification from satellite data – building on the very successful project ASIP
My employer DMI, and specifically my team at the National Centre for Climate Research are recruiting.
Not an earth-shattering revelation perhaps but these are premium research jobs, and this is probably a once in a generation opportunity in Denmark.
Let me explain. They are full time and permanent positions, working right at the cutting edge of both basic climate research, and importantly, climate services. You can see the full adverts at the links below:
DMI scientists collaborating with local hunters in the field in Greenland
I call these positions once in a generation positions because these kind of positions just don’t come up very often. Part of the reason these are now available is related to the generation change* that is coming to DMI. Right now we are fortunate also to have a number of large EU funded projects as well as danish funding for our Climate Atlas and new hydrology department which is giving us the opportunity to plan for the long term.
Sea level rise is an existential threat for Denmark, at least in the long term and we are putting a great deal of effort not just into the science of melting ice, tipping points and so forth to try and assess the potential risks, but also into planning climate adaptation and mitigation in the short and medium term.
The new positions related to climate and ice sheets and sea level rise will have some flexibility with them in terms of how the jobs evolve and research directions. There will certainly be opportunities for whoever is hired to steer in their own direction and initiate their own research programmes within the broad frame of the topics. I can certainly also only praise the management for the generally supportive and research positive encouragement.
I’d like to help cast the net wide and deep to get as strong a pool of candidates as possible, so please do feel free to get in touch with me either here or via the usual email, and other social media feeds if I can help at all. And if you have good students, postdocs or others, please do share.
We will be holding some “open house” events where you can come in person to visit DMI or sign on in a virtual event to hear more about the positions, about DMI and what it’s like to work in Denmark. Again get in touch to hear more about those.
*”Generations skift” in Danish – I have not looked at the statistics but I suspect many public institutes, including weather and climate services are greying. There was an expansion during the 80s and 90s as numerical techniques became more widespread and integrated into weather prediction and by extension climate – many of the staff employed then are getting close to retirement. In my view DMI is wise to start trying to replace these staff now so there will be continuity and knowledge exchange before it becomes a problem.