Icebergs in Ilulissat drift around the bay, sometimes fast, sometimes slow, sometimes they don’t move at all. They are drenched in the beautiful but sometimes stark light of the polar day. It’s scientifically interesting to watch them and speculate on their past trajectory and their likely future. It’s also extremely beautiful.
I’m once more on my way north to Qaanaaq, but this time I’ve been lucky enough to be able to enjoy some days off in Ilulissat. It’s an astonishing beautiful place, famous for the icebergs that come pouring out of the Ilulissat ice fjord just round the corner.
Normally, we’re only in town for one night as we have to switch planes to get to our field sites and this requires an overnight stay so it has been brilliant to be able to use a little holiday here.

I have been using the time to work on some papers and try to clear some of the back log of reports and emails, but there has at least been some time for a couple of hikes in the back country nearby. I could post several hundred photos of icebergs and other magnificent views, but I was struck by the movement of icebergs in the bay outside my window while I was working yesterday.
Sometimes the big bergs seemed to move more, sometimes they seem stuck. I wanted to check this so I set up a time lapse on my tablet in the window of the guest house I’m staying in overnight (bearing in mind it’s the Polar Day so doesn’t actually get dark). I think it actually ran out of power before covering the full six hours I set it up for, so I’m now trying a full day. However, it was enough to show my perception was basically right and I have come to the conclusion the changing movement is related to the tides.
You can see the full almost a minute long film at my peertube account below.
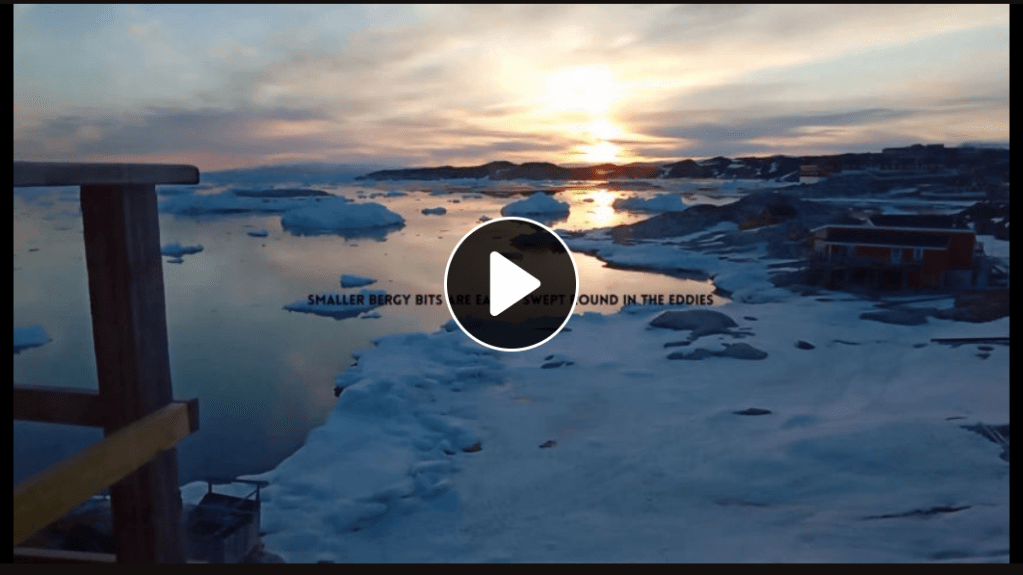
This is also a bit of an excuse to play around with video editing a little, in this case I’m trying out canva, and to advertise my peertube account @icesheets_climate on TILvids.com.
As I’ve alluded to before, I’m trying out the non-corporate social media fediverse and it’s actually quite fun, though the videos are a bit time-consuming so I’m not quite sure how regularly I will manage to post these on my channel, but the clue is in the name on what most of them are about I guess…

But I have gratuitously many photos on my pixelfed account and no doubt more to come. I’m also planning some icebreaker shorts describing different elements of the environment that I’m working on. We’ll have to see how much time I have to actually get those finished, they typically take a while!
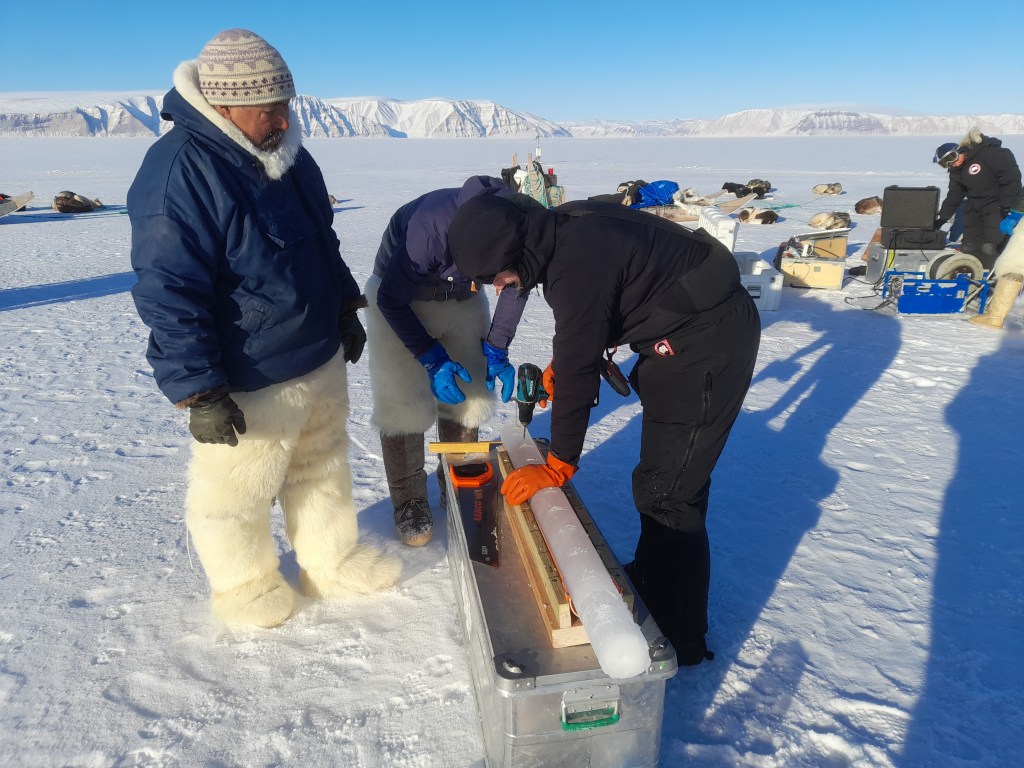
Of course, these are not just pretty pictures – I have a professional interest in icebergs – my PhD was about ice fracture and applying models of crevasse formation to describe a new parameterisation of calving. One of the projects I’m working on in northern Greenland, (funded by the danish state through the National Centre for Climate Research, NCKF) is also focused on calving processes, and specifically the role of ice melange in the system. In fact, one of the papers I’ve been working on this week analyses those iceberg related datasets. It’s immensely valuable and rare that I have the opportunity to be able to focus on the process in the field at the same time as writing the paper.
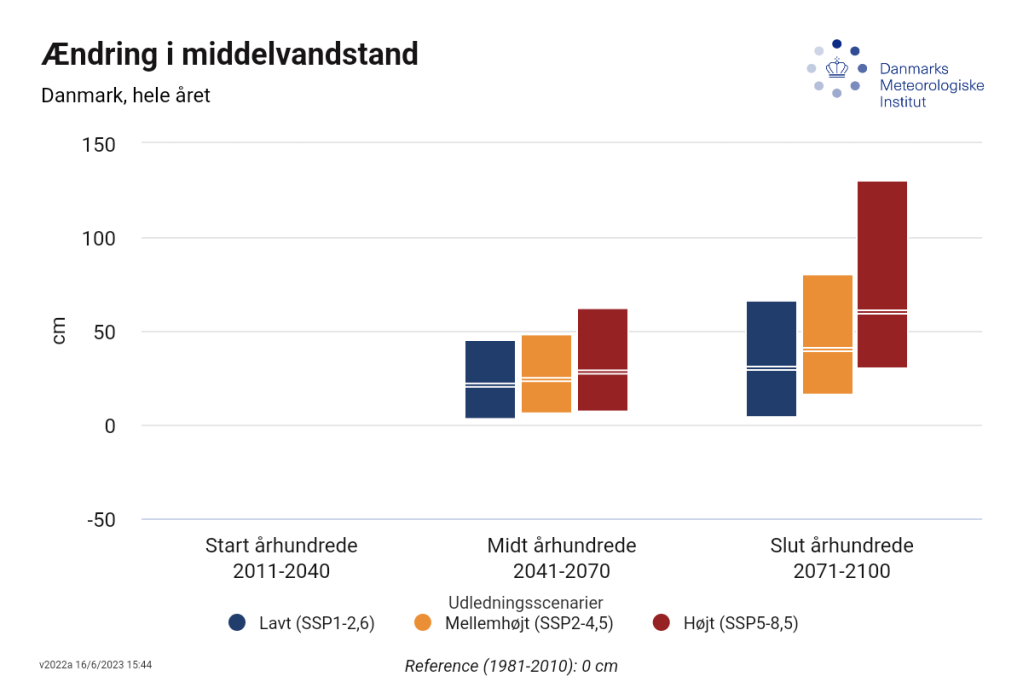
I have 2 more days in Ilulissat, so no doubt there will be more walks around town and more iceberg photos, but I have sent the iceberg paper back to my co-authors now, so it’s time to focus on a new paper – and the climate of the polar regions in the future.