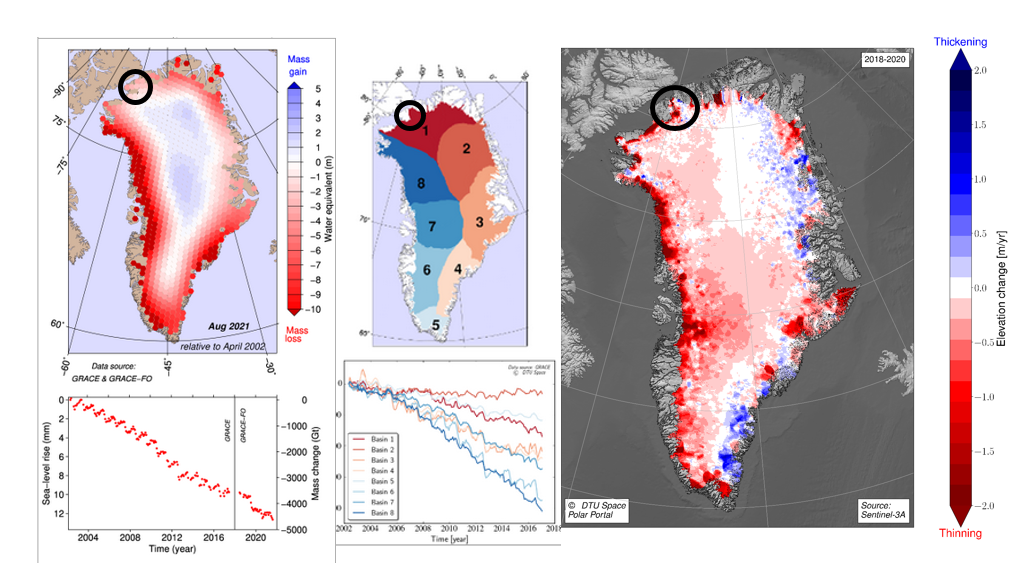
This post is in response to a thread posted on blue sky* by Jeremy Bassis and a discussion between Felicity mcCormack and Gavin Schmidt. All these people are well-respected climate scientists and the original thread was posted as a result of a Nature piece about operationalising climate models (and sea level rise), like we forecast the weather. This is something I’ve been thinking about for a while too, as sea level rise is an undeniable existential threat to my home country…

Anyway, I replied with a link to the Danish Climate Atlas – which to my mind is very much a model for how climate information should be done. I can’t give a full overview of the Climate Atlas, largely because it’s not my story to tell, but as Jeremy asked me to talk more in depth about it, and given the 300 character limit, I thought I’d formulate a few thoughts here first before sharing…
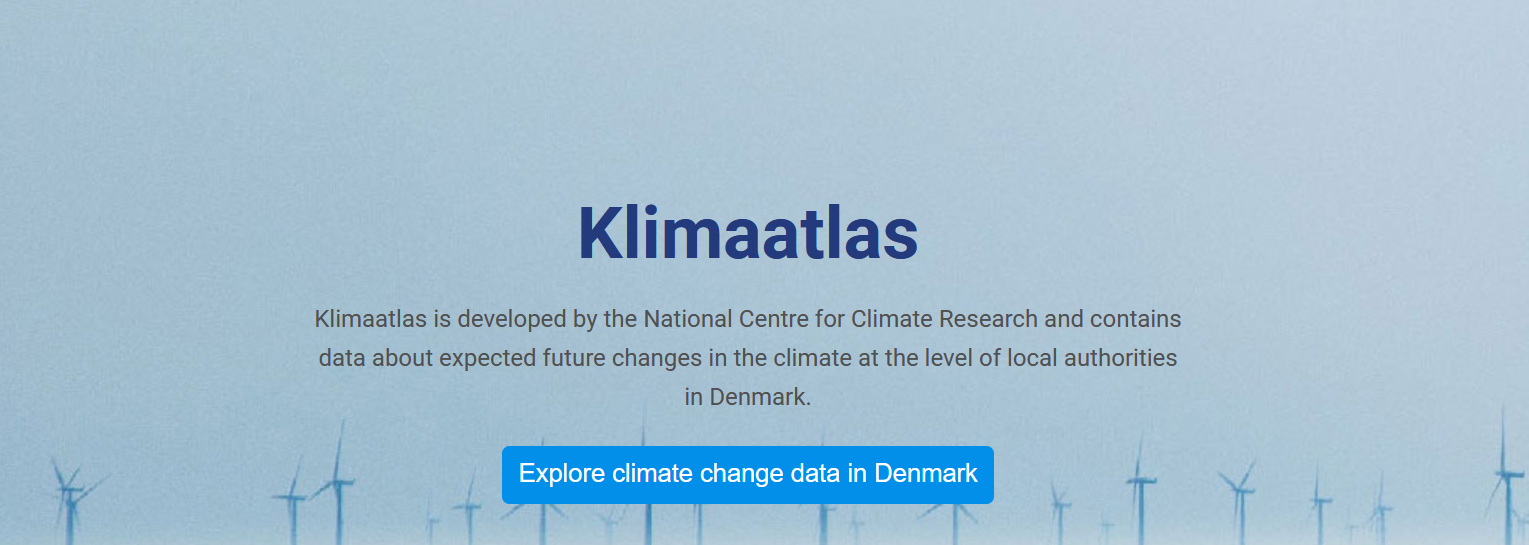
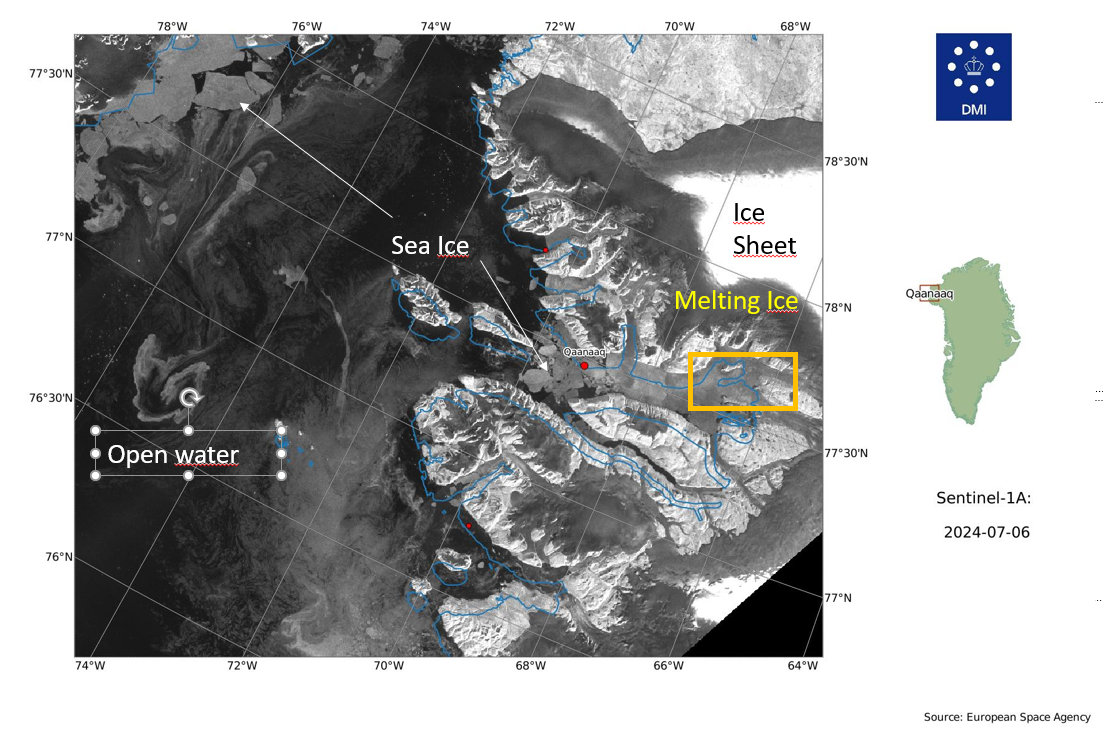
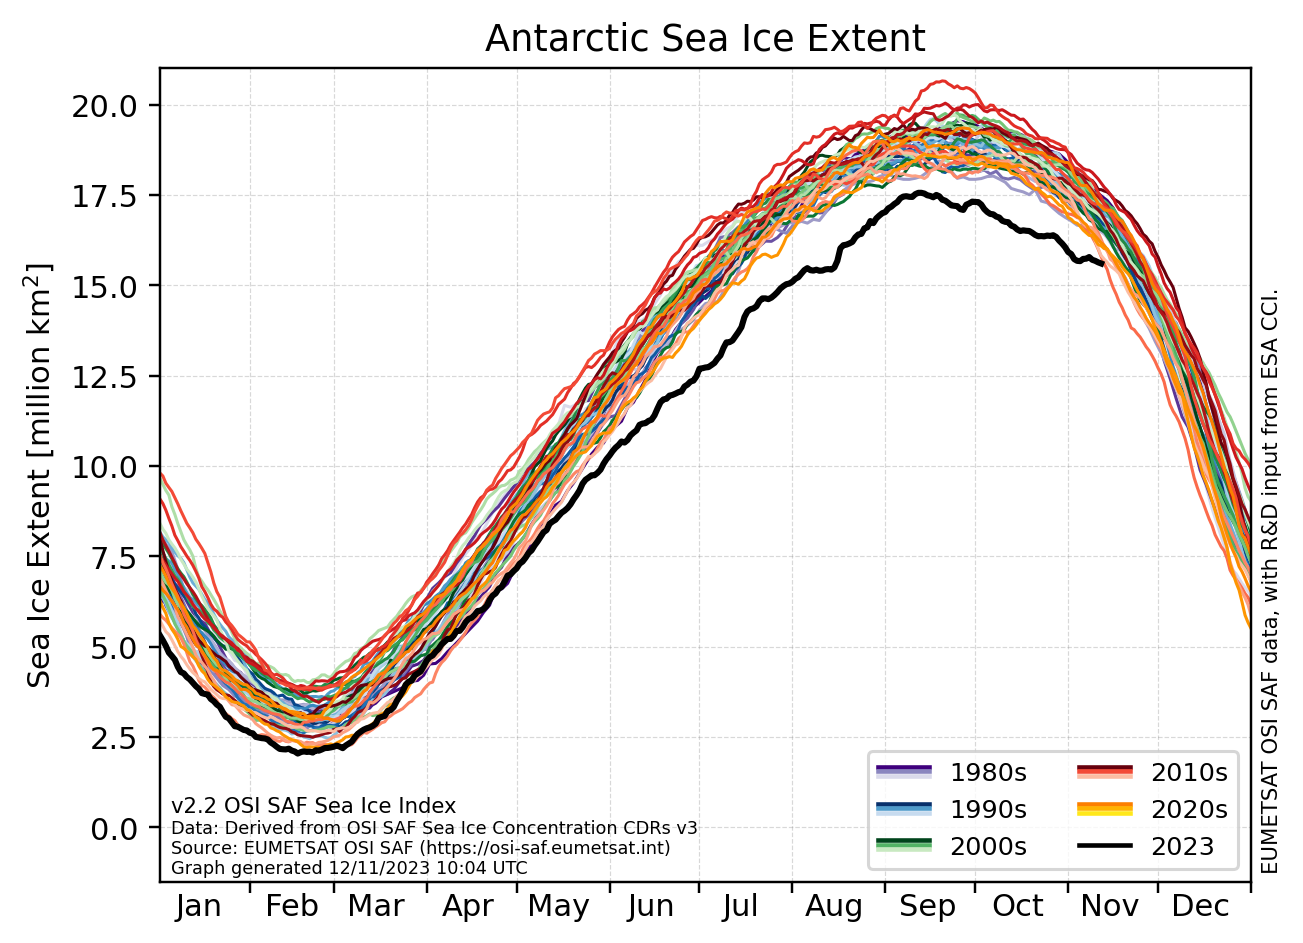
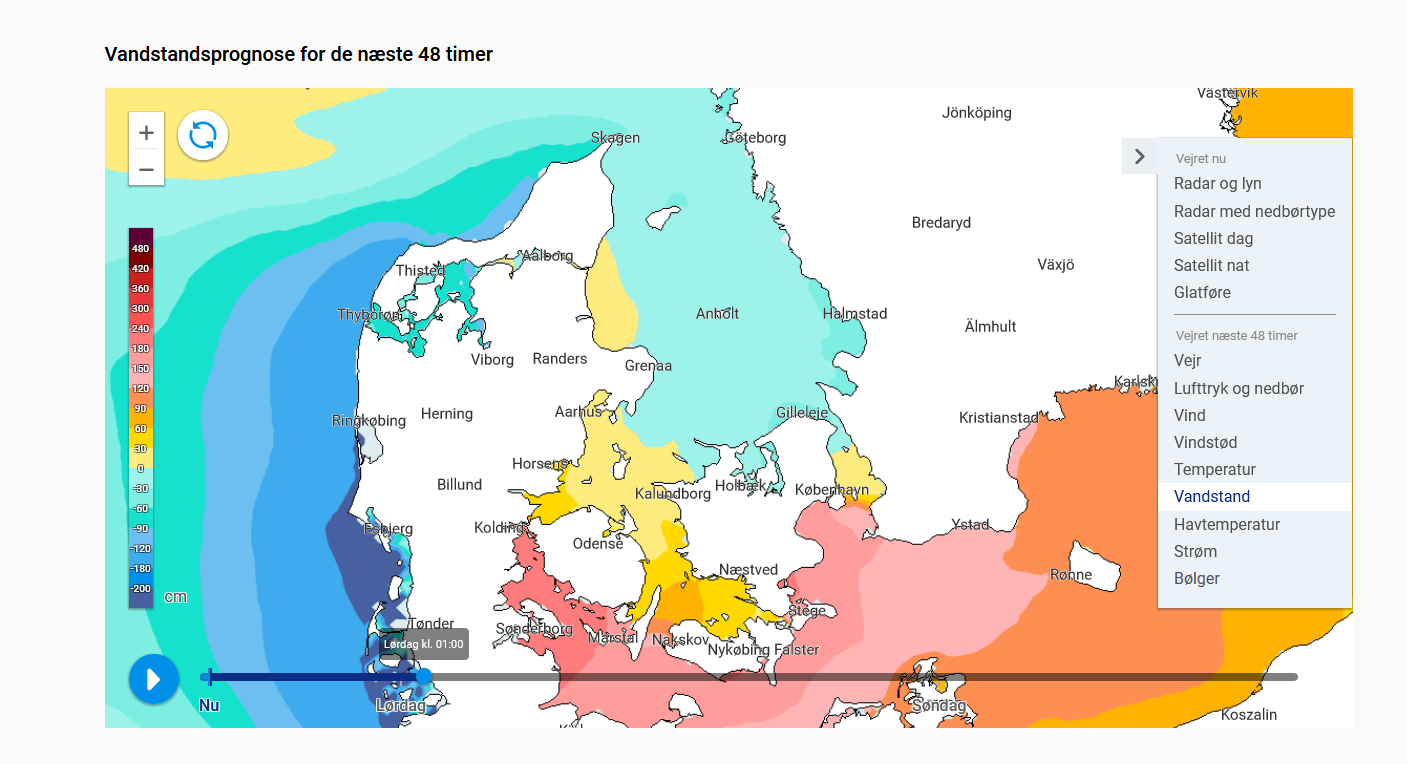
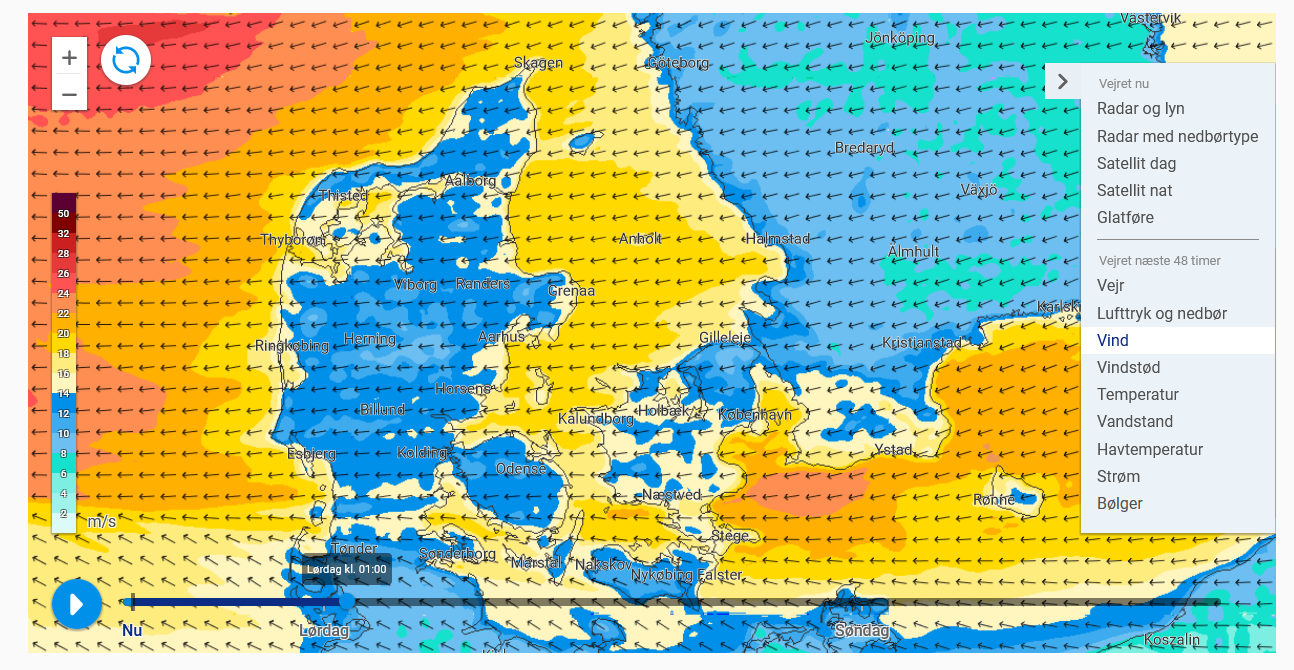
The climate atlas is not a book but a web frontpage that allows anyone with an internet connection to get high quality climate information at a local scale in Denmark. The map interface makes it easy and intuitive to use, and for detail a whole bunch of reports and datasets in different formats can be downloaded (everything from ASCII to GIS to netcdf). You can explore it here. All the data is given on a kommune (local authority) level except for sea level rise data which is divided up by coastal stretches.
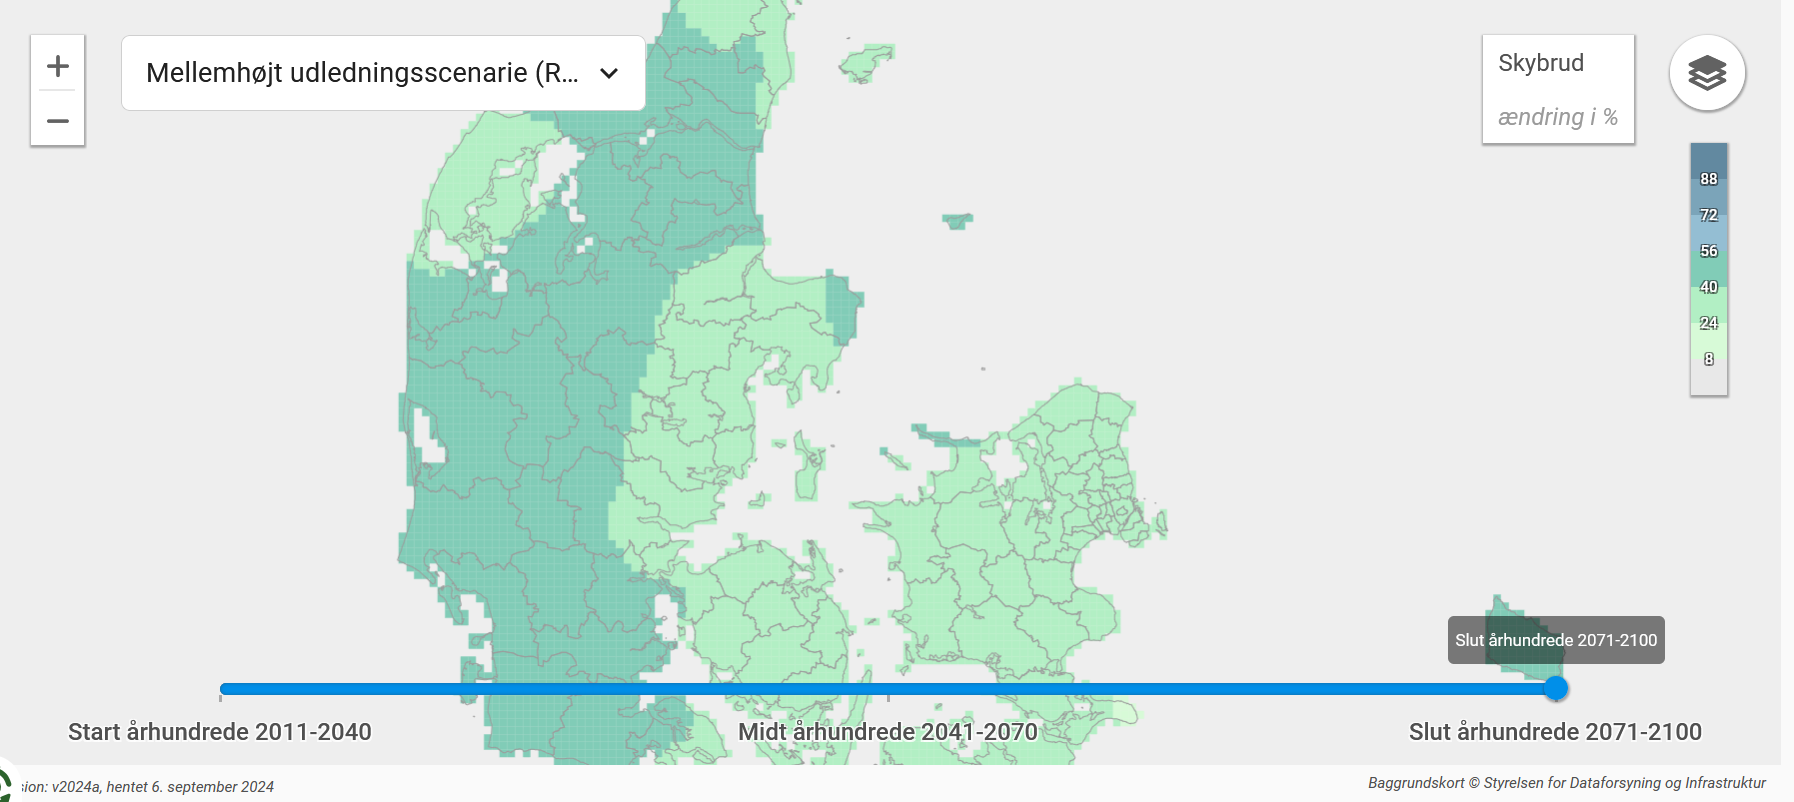
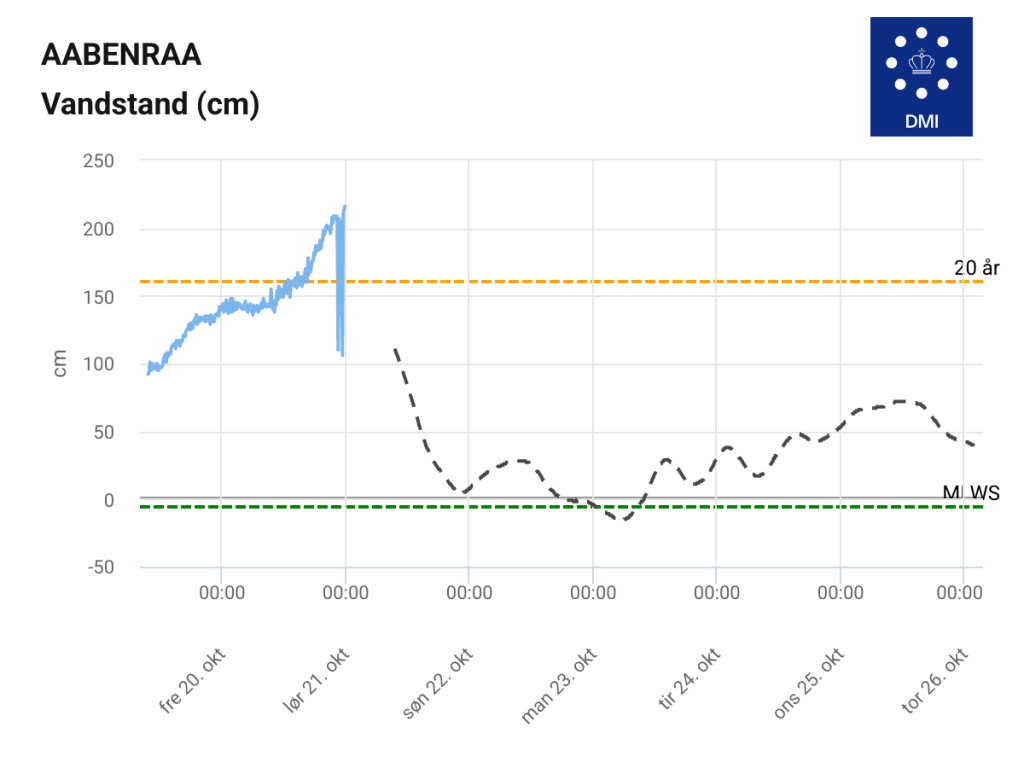
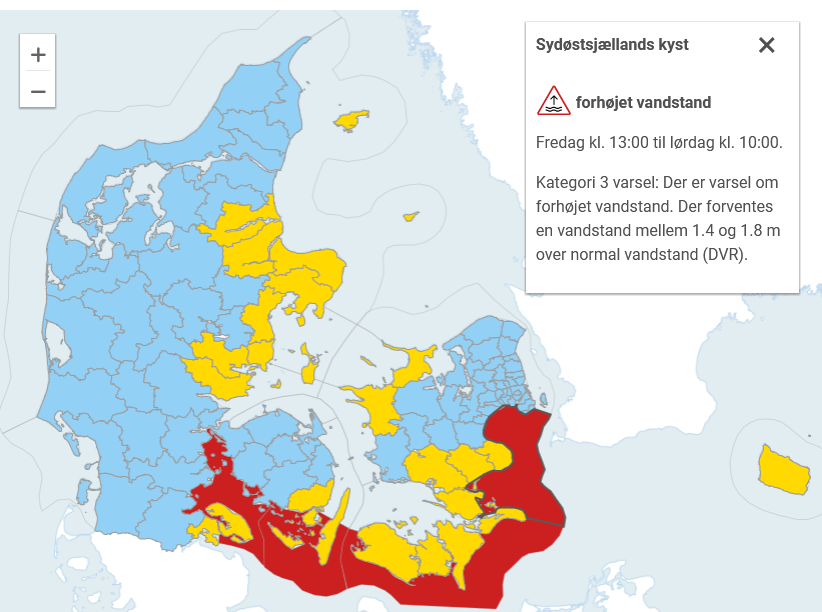
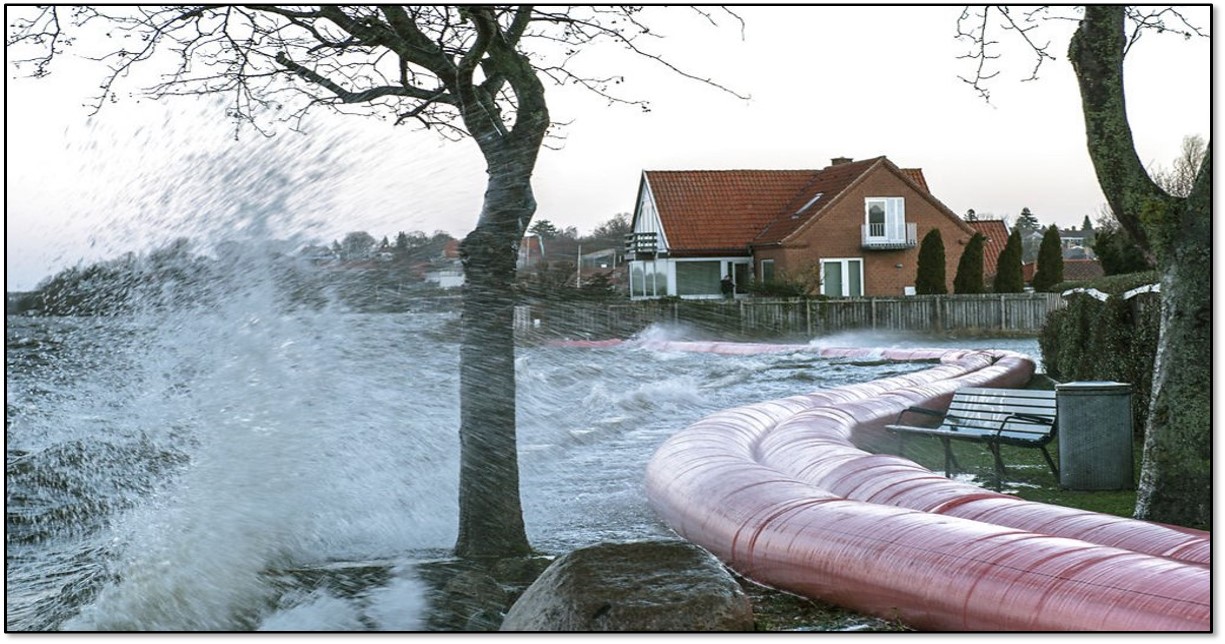
For audiences that just want a quick message there are these easy to interpret icons with a key message below, like this one about higher water levels.

I was involved in the early stages and to my mind there are 4 crucial elements that have made it very successful:
- Legal Requirement: Every local authority (a kommune, don’t think hippies, think regional councils) in Denmark has a legal obligation to make climate adaptation plans and to keep them updated. This element is important as it created awareness of the problem and effects of climate change and the necessity of investigating adaptation options. The initial plans were rather patchy and not very consistent with each other. Many regions had employed a consultant who was also maybe not an expert. Several kommune ended up with data based on CMIP resolution data! Hardly appropriate for a small local region in Denmark (which is barely resolved in most global climate models).
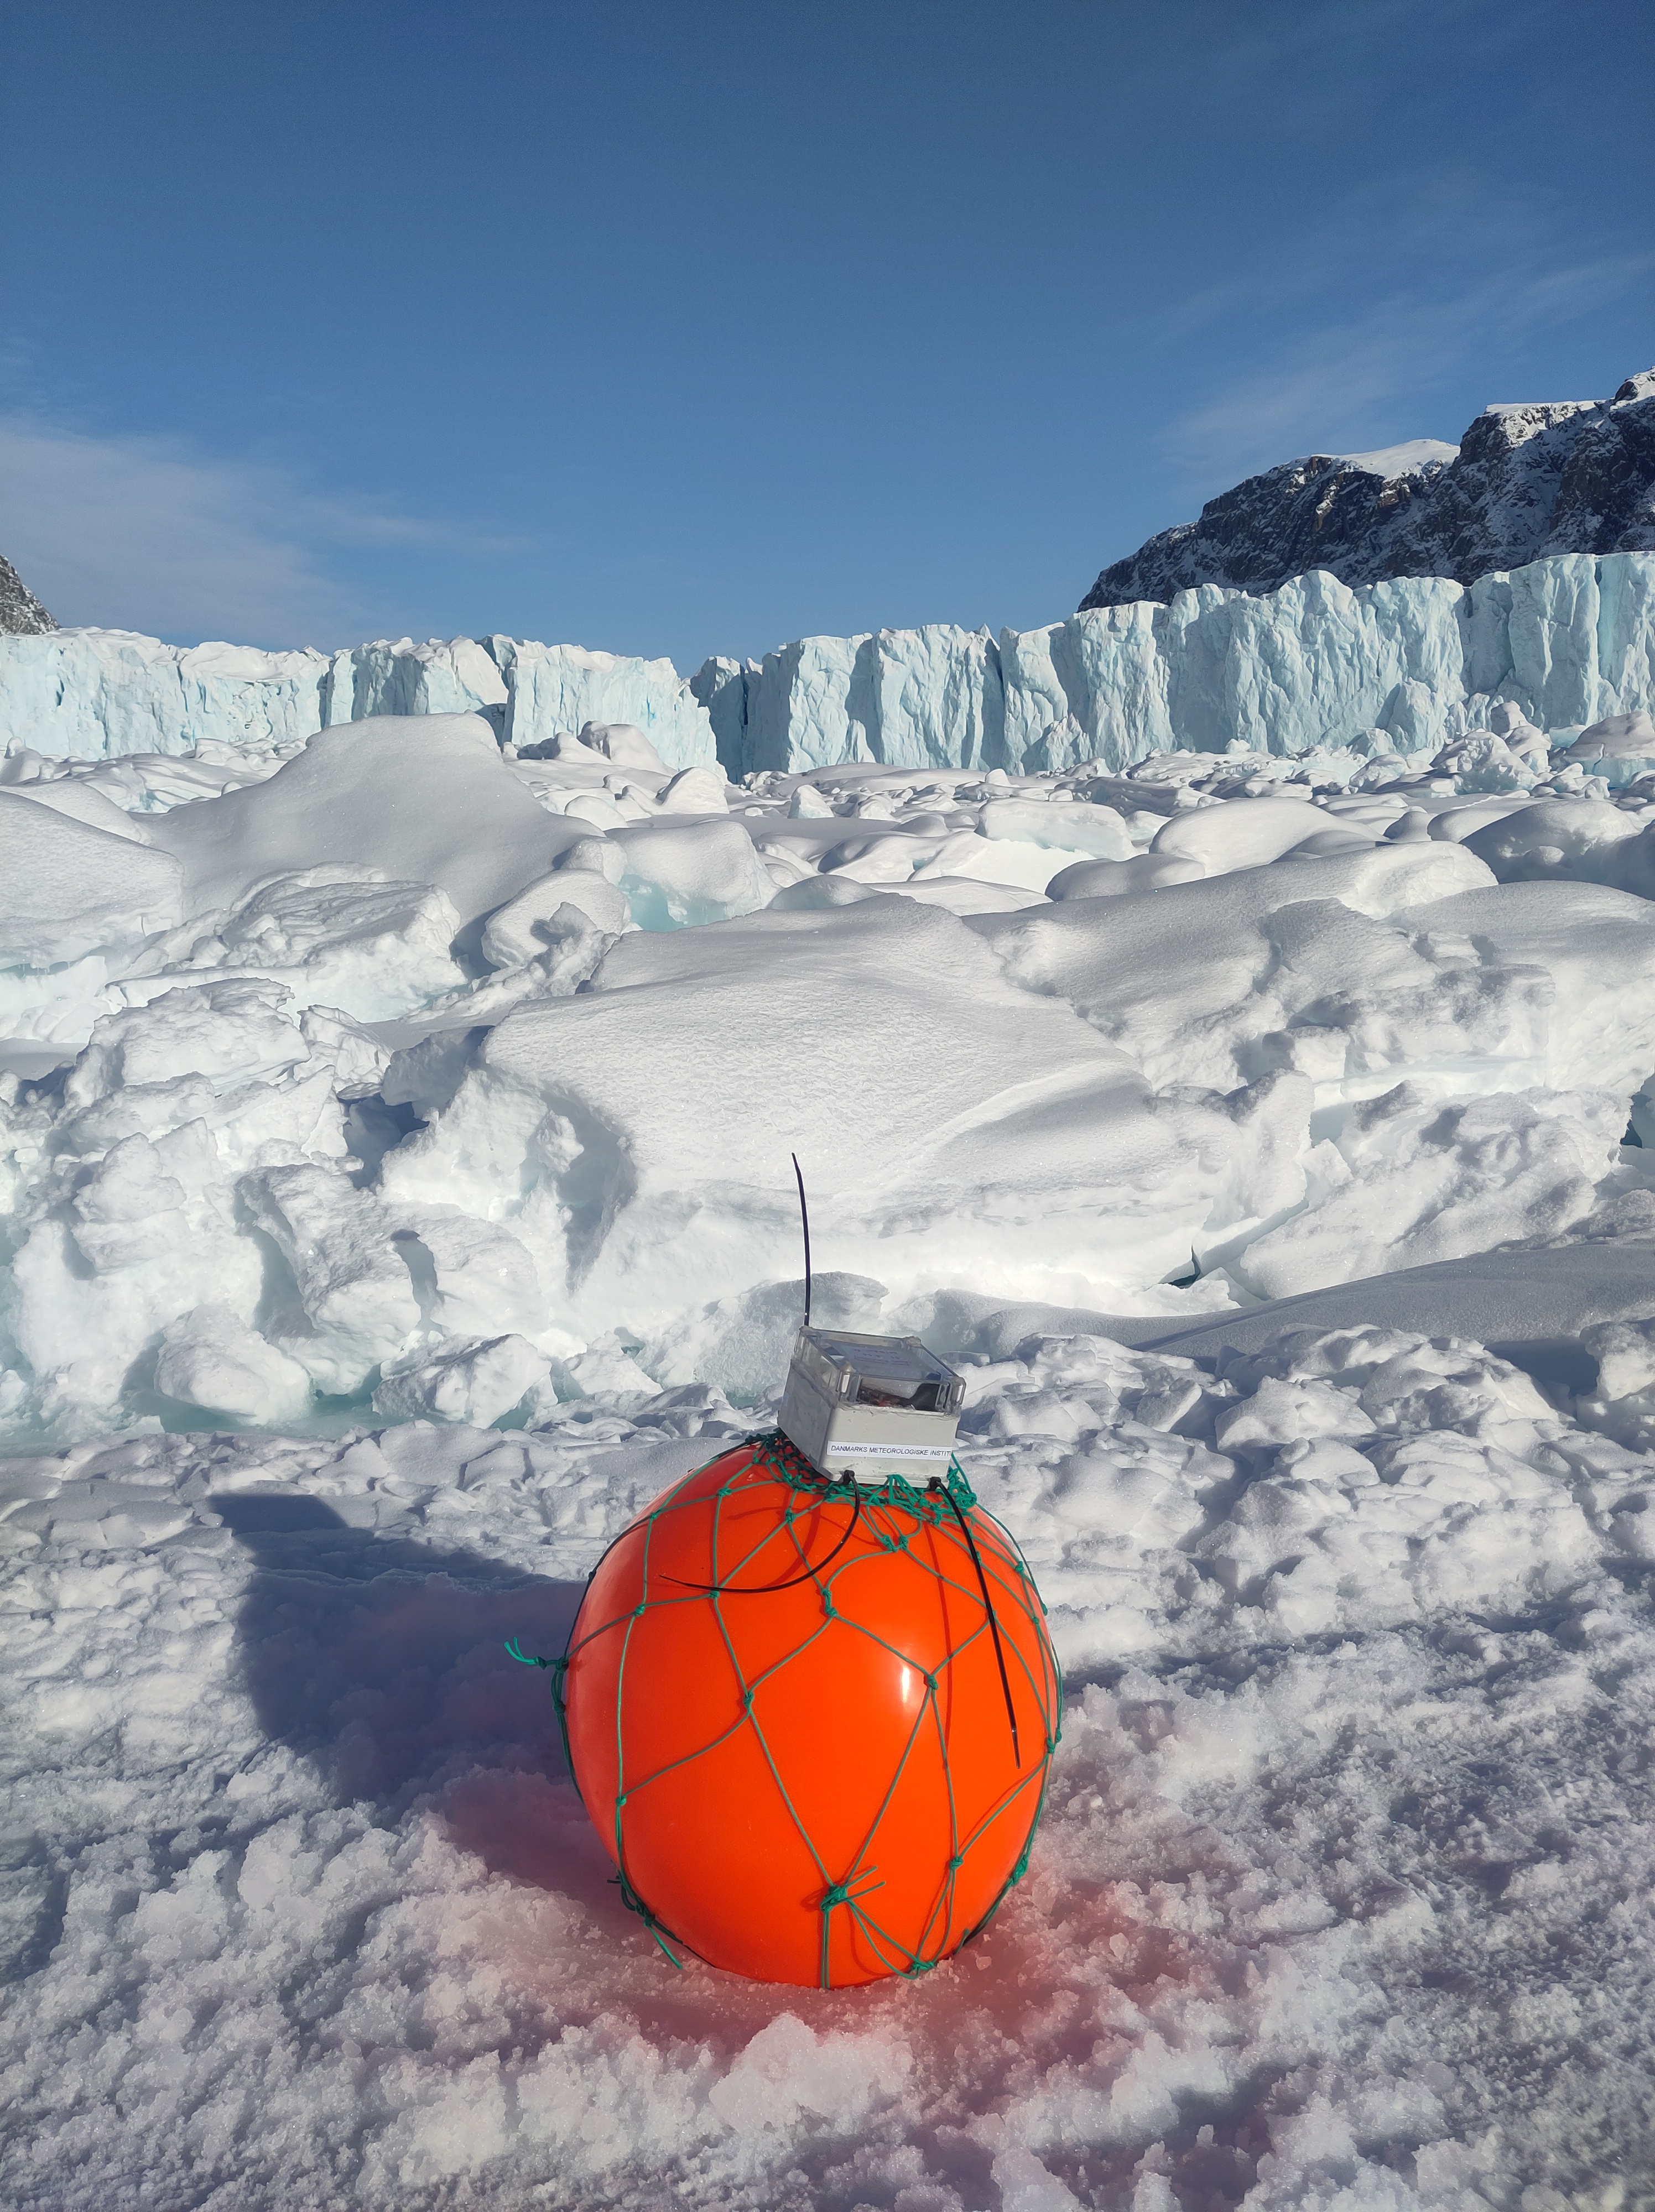
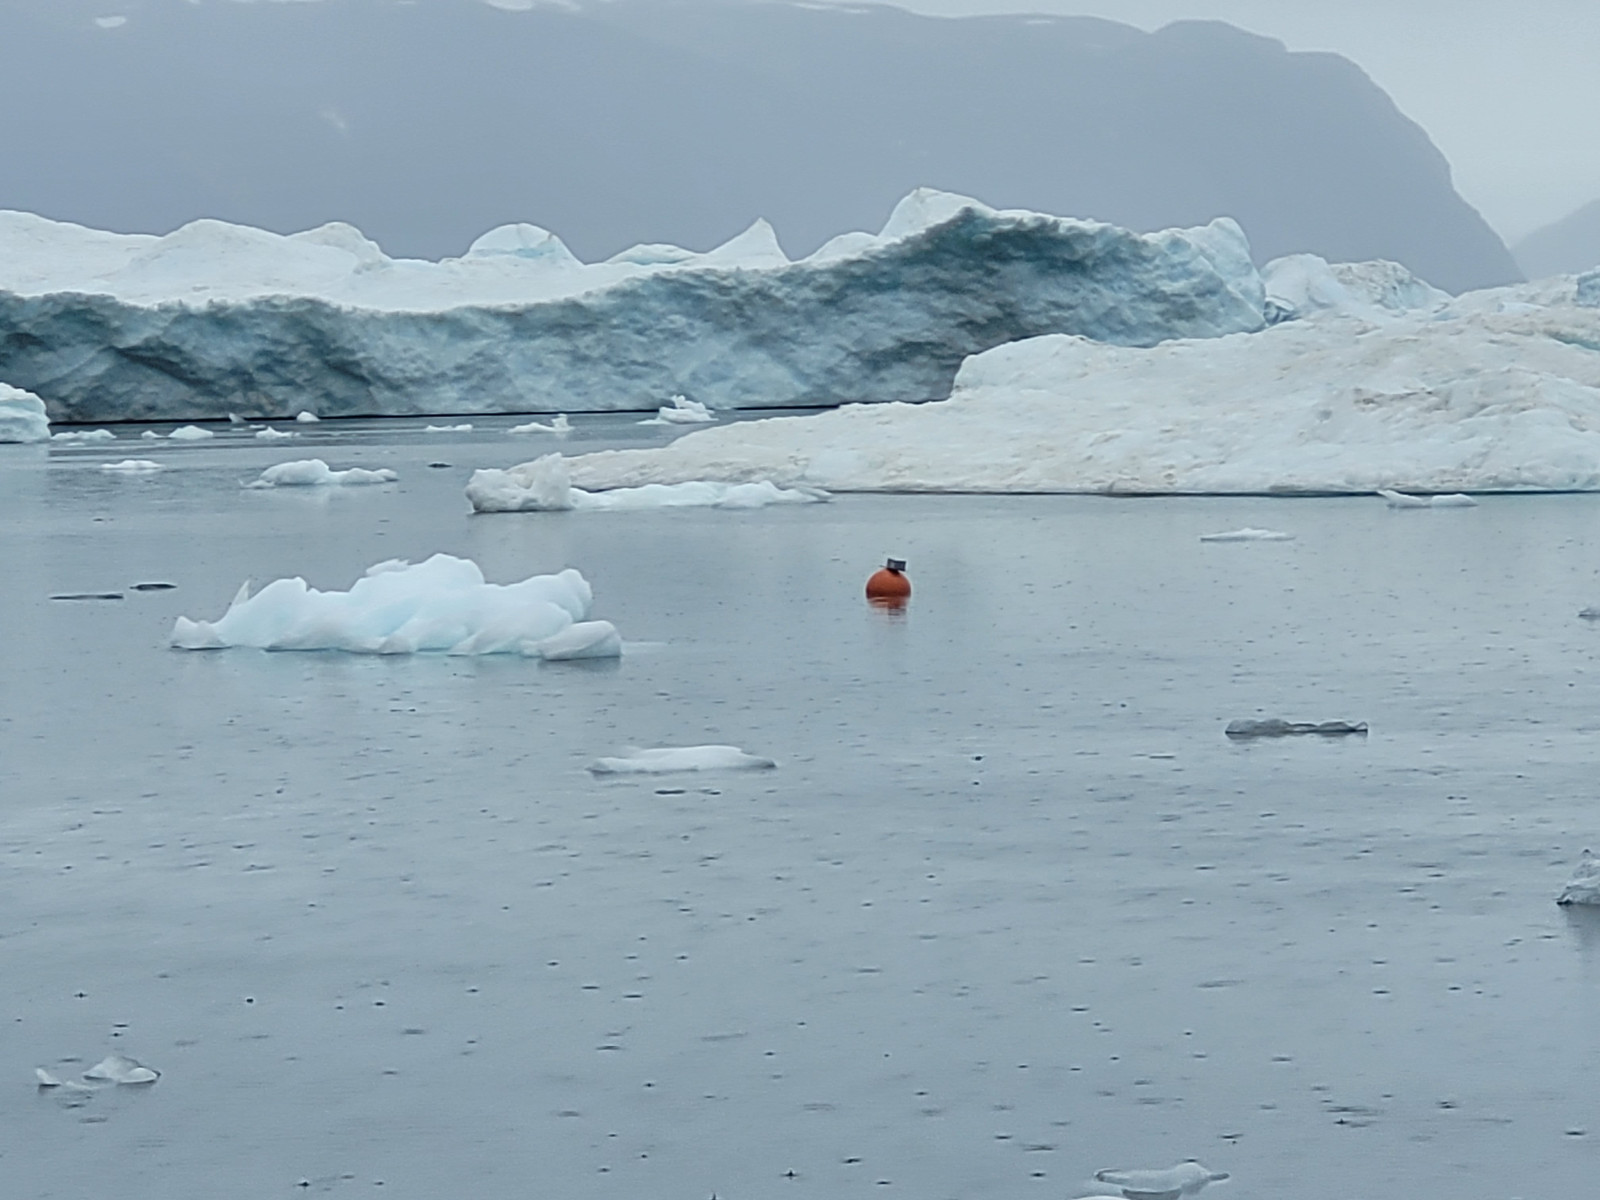
- Data Foundation: At the same time we have been dynamically downscaling these simulations for decades, to provide really high quality locally bias corrected data (using also DMI’s long climatological time series to understand if and where biases exist). Colleagues at DMI identified a need to provide this in an easy to use format to everyone in the country. We had long ago discovered that working with motivated kommune employees led to a really good outcome: readable climate variables that are meaningful to an individual city, data formats that can be used by non-scienists (who definitely can’t deal with netCDFs).
- Funding: Doing a data project properly requires money. The Climate Atlas is, compared to the cost of not doing anything, extremely cheap, nonetheless, it still costs something. Ear marked funding from the danish state to build up the Climate Atlas from the ground, to develop it as new needs are identified and to improve both communication and presentation has been crucial. Along the way several different needs have arisen (droughts, deep uncertainty in sea level rise), a new version will hopefully be coming soon.
- Intense engagement: Probably the most crucial aspect to getting the climate atlas off the ground and into use has been communication over and over and over again. Not just initially with kommune to find out what they need (building on many years of background experience first), but also reaching out to special interest groups raning from local farmers in mid-west Jylland to sewage engineers, high school teachers and property developers. This continues, but has undeniably been helped by Denmark’s open trusting society and generous tradition of cultural meetings, continuing education and festivals.
The climate atlas in Denmark is the example I know best, we should be rightly proud of the team that constructed, maintain and continue to develop it. Other countries certainly have similar products in the Nordic and Blatic countries, and likely elsewhere, a network meets annually within the region to discuss developments etc. After a coincidental meeting, DMI was also invited to help develop one for Ghana, which is ongoing, and of course, will have completely different needs and requirements, However, the decision early one to base the back end of the Climate Atlas on open tools: python, cdo, github and CORDEX simulations, makes a lot of the learnings transferable.
If you want to know more, contact my colleagues at the Klima Atlas! I’m happy to put you in touch..
*As an aside, it’s interesting how many of the climate science and policy community have moved over to Blue Sky. It was rather quiet for a while but activity seems to have picked up. I’m not abandoning mastodon, which I actually prefer, but I’m happy to see an alternative to what has become known as Birdchan. I’d urge you to try it if you’re interested in a social media presence in a slightly more appealing environment. There are a number of handy tools, including fedica, that allow you to crosspost to multiple channels at the same time (including X, mastodon, bsky, TikTok and threads) and I’m also using the OpenVibe app, which has a common timeline from multiple platforms.