I was recently asked to comment on this interesting new paper by David Rounce and co-authors for AP by Seth Borenstein called “Global glacier change in the 21st century: Every increase in temperature matters”. You can read his resulting summary here . I’m posting here the slightly expanded and lightly edited response I sent to Seth in response to his (very good) questions.
The authors only look at the small glaciers and ice caps in this study, not the big polar ice sheets, though they do also cover small peripheral glaciers in Greenland and Antarctica that are not part of the main ice sheets. Of course, this means that sea level rise from all the other important processes like thermal expansion and ice sheet met also have to be taken into account on top of the numbers given here.
Their main findings were that at 1.5 °C above preindustrial, we can expect total glacial mass loss between 2015 and 2100 would be 26% with 90 mm of sea level rise and 49% of the small glaciers and ice caps lost globally. The paper only deals with these small glaciers and does not count the big ice sheets!
At 4°C, we’re looking at 41% mass loss with ~154 mm of sea level rise and 83% of glaciers lost. At 2.7 °C, where the world is now heading, 32% mass loss, 115 mm of sea level rise and 68% of glaciers lost.
I’m sad to say that the results aren’t exactly a surprise – the community has known for some time that the loss of glaciers is basically linear with temperature, so the title of the paper is really spot on, every tenth of a degree really does matter. This earlier paper by my Horizon 2020 PROTECT project collaborator Ben Marzeion shows something very similar But it’s a nice new result with the latest generation of glacier model and updated with the latest CMIP (IPCC) scenarios and they included some new processes that weren’t very well accounted for in previous work.
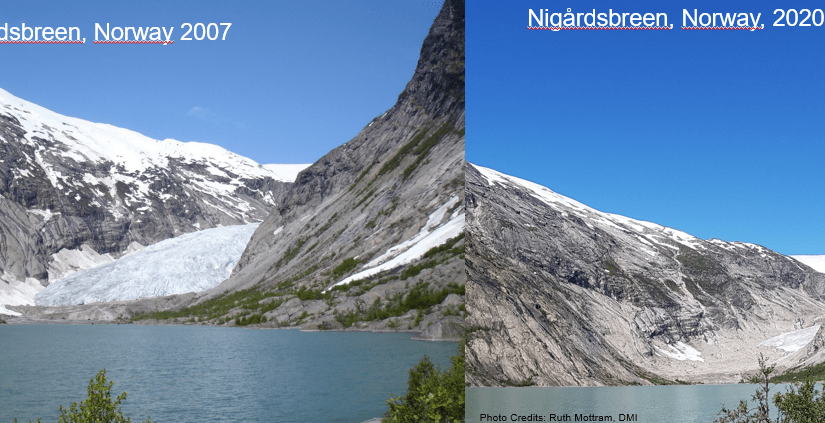
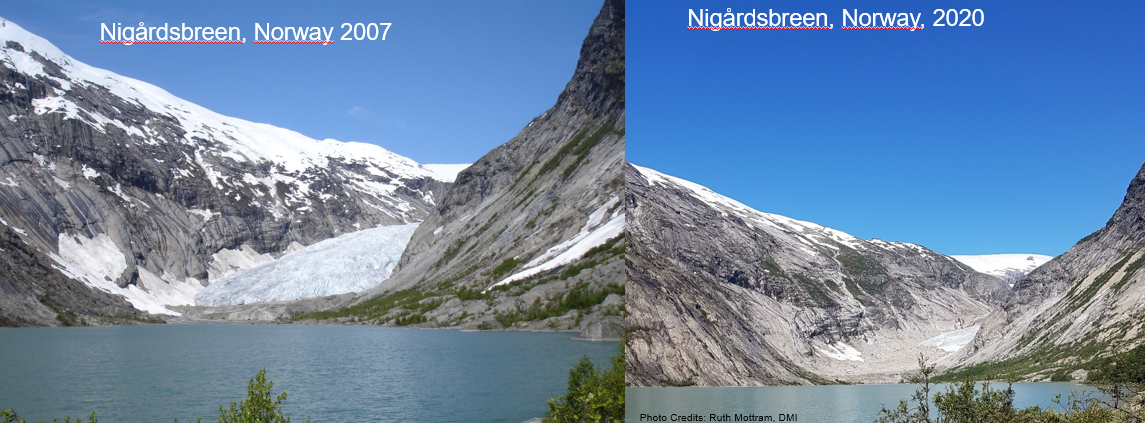
My first thought was that these latest estimates were actually a little lower than I expected, but the baseline in the paper is 2015 – we should remember that many of these glaciers have already lost quite a lot of ice (see my two photos of Nigårdsbreen in Norway, taken only 13 years apart) – so the new estimates are basically in line with what I would have expected given earlier work. I’d also expect that they will continue to lose ice beyond 2100 so it’s definitely not an end state that they are giving here. As they state in the article there will be widespread deglaciation of some pretty iconic parts of the world, even under the present planned emissions reductions..
In many ways part of the problem has been the previous studies have not always accounted for all the processes: frontal ablation (melt and calving of vertical ice cliffs, mostly in contact with water), the effect of debris cover and so forth (the latter will likely reduce the rate of loss, the former probably increases it). Given what we know about these processes and how to represent them in models, I still consider this work to be a more realistic estimate. Then we also need to account for the climate models and the scenarios used to force them – there are some important differences between CMIP5 and CMIP6 which might also account for some of this shift. We have actually seen something somewhat similar for the projected changes in the big ice sheets.
It’s probably important to remember though that this study still needs to make simplifications, especially when looking at so many glaciers in so many different regions, so there will always be new updates to come with improved computing power and computational techniques and better representation of processes. Having said that, I do not think the picture will substantially change in future, though I can always be proved wrong, and the glaciers community are now at the stage of refining estimates for rates of mass loss.
Globally the loss of glaciers means sea level rise. Regionally and locally the biggest consequences will be for for water resources and we’re likely to see a local increase in natural hazards like outburst floods and avalanches that will need to be carefully managed. There have been a couple of instances already in the last year or two that probably demonstrate this well (e.g. the Marmolada glacier in Italy last year).
Sea level budget divided into components, from Legeais et al. 2018 ESSD The steric component is the expansion of sea water as it warms.
I include myself in the group who has to get used to the cultural shift. I have worked on glaciers in the Alps and Norway which are really rapidly disappearing. It’s kind of devastating to see, but it’s not actually surprising. We have known it was coming and in many cases (including the authors of this paper), measured the massive losses (last year, 2022 was a disaster for the Alps and both Fabien Maussion and Matthias Huss who are co-authors on the paper are running very comprehensive programmes that show in real time how much of a disaster) and predicted it with some accuracy. But we’re now at the point where it’s really undeniable that these glaciers are going fast.
#Glacier ice melt in 2022 was impressive! See the incredible speed of ice loss at the snout of Rhonegletscher (@VAW_glaciology time lapse by A. Cremona)…
The Rhonegletscher in the timelapse above is a really iconic glacier in the Alps, I have my own favourites, mostly places I’ve worked, like Norway, Iceland and Greenland, which are all to a greater or lesser extent retreating fast now. The glaciers that people consider iconic or at least well-known tend to be accessible and depend very much where you are and they will be the glaciers we mourn over in the next decades. In the French Alps, it’s probably the Mer de Glace, in Switzerland perhaps Rhone glacier or Plaine Morte (both have monitoring programmes), in Canada perhaps the Malaspina or Athabasca glaciers. There are still (just) glaciers on Kilimanjaro and Mount Kenya, the Ruwenzoris are basically gone, as are the Papuan glaciers.
Though they show in the study that ice loss is basically linear with temperature, at some point the glaciers become so small that the remianing melt is highly non-linear. And these won’t grow back under any sensible “overshoot” scenario (never mind that we don’t really have technology to remove carbon from the atmosphere at scale). Once they’re gone, they’re basically gone forever on human timescales Finally, I’d like to add a bit of anlaysis by Ben Marzeion and co-authors , it’s possible to basically put a number on the amount of melted glacier ice each kg of CO₂ leads to.
We find that under present-day climate conditions, every emitted kg of CO2 will eventually be responsible for a glacier mass loss of 15.8 (5.9–20.5) kg. Again, since the global glacier mass is decreasing with increasing temperatures, this number is greater for lower temperatures and smaller for higher temperatures.
I have been meaning to write about my return to field science (after 10 years mostly working on climate models) for the last 2 years, but prompted by this beautifully written piece in the Danish Newspaper information, I decided Christmas Day was the day (it for sure beats the washing up)…
“For at forstå, hvad der er ved at ske ved kloden, rejste vi mod isens ende” “To understand what is happening to the earth, we travelled to the end of the ice”
Martin Bahn og Anders Rye Skjoldjensen (foto) in Information 23rd December 2022
To make one thing very clear straight away, and as the newspaper article also makes very clear, my colleague Steffen Malskær Olsen has established and maintained a very long-running programme of observations in the fjord near Qaanaaq. This town in northern Greenland on the edge of a large fjord, and close to the North Water polynya has a uniquely interesting location to study and understand Arctic processes. The DMI facility there is long established and part of the INTERACT network of Arctic field stations. The 15-year record collected by Steffen is more or less unbroken and uniquely valuable. None of the science I’m planning to do or to work on would be possible without his dedication, hard work, insight and bridge building within the community in Qaanaaq. He and my other DMI colleagues involved in this programme are brilliant scientists and great field companions and I feel privileged to be able to work with them in this incredible place.
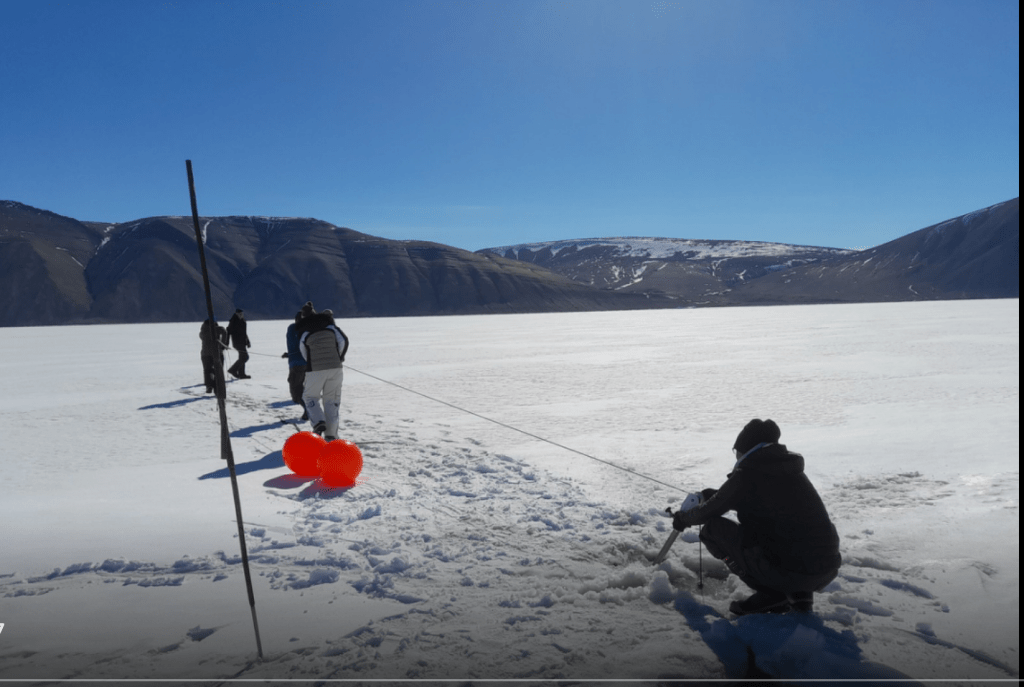
In the field: Steffen and team retrieving an oceanographic mooring with instruments on it after a winter out in the fjord in 2021.
Secondly, as the article also makes clear, scientists are not individualistic heroes who beat the odds, it’s a team sport. And it’s especially true in Greenland where the true heroes of this story are probably not scientists but the local hunters and fishers who guide and transport us and whose knowledge and experience is unmatched. I include also on this category our DMI colleague Aksel Ascanius who lives and works in Qaanaaq has been an essential part of the programme since the earliest days, as well as keeping other long-term observations in the network running in this part of the world.
Collaboration with the people who live in the Arctic has been essential for success in Arctic science since since the days of Franklin and Rae (for British readers) or Suersaq, aka Hans Hendrik, (after whom Hans Island is named) for Danes..
Anyway, back to the science of the present-day. DMI has progressively added more and more elements to the field laboratory in Qaanaaq in addition to the longer running observations. A non-exhaustive list would include an infrasound monitoring station that is part of the CTBTO, weather observations (of course), surface emissivity measurements by drone, fjord salinity, temperature and photosynthetically available radiation measurements plus snow and sea ice measurements as well as work with satellites and biology. One glaring omission, up to this year at least, was the glaciology of the region. How does the ice sheet affect the regional climate, how does the ocean affect the glaciers that calve into the fjord? Can we learn about some important but poorly understood processes like calving and melange dynamics using this area as a test bed? What about surface mass budget and snowfall and snow melt?
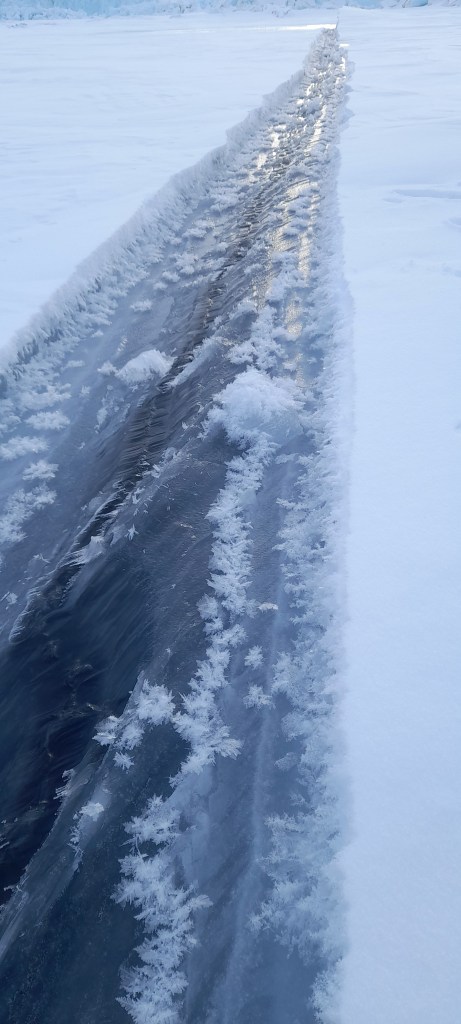
A lead in the sea ice – these fractures in the ice have sea water (the black) welling up between two thick plates of sea ice. The conditions were perfect for frost flowers to grow on the surface. Sea ice turns out to be a lot more interesting – and complex- than I’d ever imagined…
Now, as a glaciologist, I’ve mostly worked with the interface between atmosphere and ice sheet (at least the last 14 years or so, but I am also still (after my PhD topic on ice fracture and crevasses) interested in calving glaciers and the processes that control how fast icebergs form. And the fjord, Inglefield Bredning has *a lot* of calving glaciers in it. It is a natural laboratory for glaciology and for developing numerical models. Calving is actually a surprisingly difficult thing to model with computer models of glaciers.
Or perhaps it’s not that surprising?
Observations are difficult to get (to put it mildly). There are a number of (possibly wild) theories of “calving laws” that remain poorly constrained by observations as a result. Common parameterizations of ice flow makes it hard to deal with fast flowing glaciers where calving is common. Dealing with grounding lines, where glaciers meet the sea and start to come close to flotation can give notorious numerical errors and retreat requires the remaking of ocean grids in fully coupled climate models.
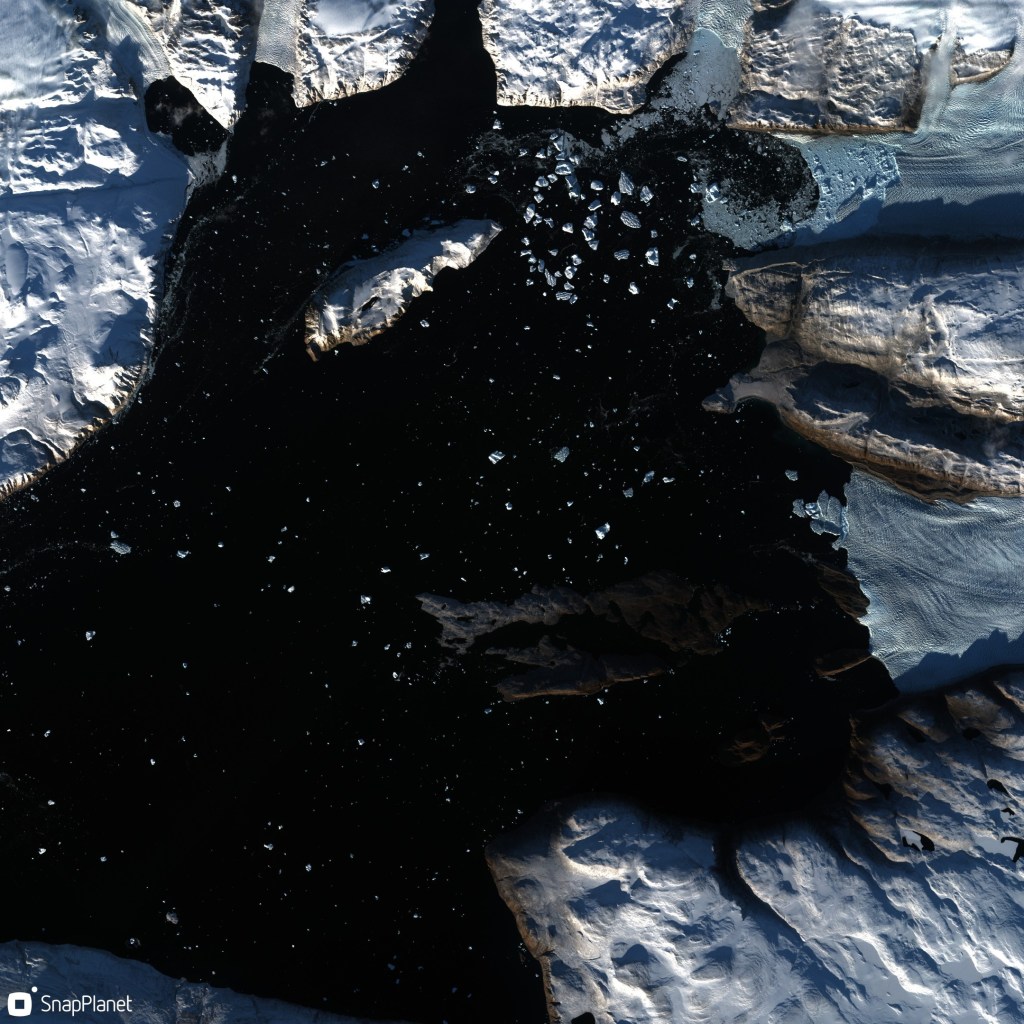
Satellite image from ESA’s Sentinel-2 satellite showing glaciers calving icebergs into the head of the Ingle field Bredning fjord. The black is open water, icebergs show up as blueish dots, the land is carpeted in snow. Low winter sun (in late September 2022) casts deep shadows.
These are not easy or computationally cheap problems to solve. And where there are at least thousands (maybe even tens of thousands?) of scientists working on atmospheric weather and climate modelling, the community working on ice sheet dynamic models is probably only in the low hundreds.
And of course, we really lack long time series of measurements – essential in a system that changes only s l o w l y, but likely irreversibly and which we are, only now as the system is changing rapidly, starting to understand.
This of course is why the fjord observation record of Steffen is so valuable – these are reliable, repeated measurements of ocean properties that are known to affect the outlet glaciers that meet them. It is indeed a natural laboratory.
What we are now also working on is a field lab to study these calving processes in-situ. I have already found the return to the field scientifically valuable. There is really no replacement for going to observe the earth system you want to understand. (My PhD supervisor used to call it “nurturing your inner glacier”). Observations taken in spring/summer 2022 have already changed how I think about some processes and hopefully the follow-up we have planned in 2023 will confirm our new theoretical framework.
Heading home from the deployment of instruments out near calving glaciers at the head of the fjord.
I am fortunate indeed in that at the same research department, we also have colleagues collecting and analyzing satellite data and developing the numerical models we want to use to understand how ice sheets fit into the earth system. All three of these elements – field, satellite and numerical model- are essential.
In this project we are using the satellite observations to extend the time series of field data and we can use both sets of observations together to develop and test a numerical model of this fjord and the glaciers that calve into it. The numerical model we can then extend to other glaciers in Greenland. Hopefully, we can also use this work to understand how Antarctic glaciers might also respond to a warming ocean. Ultimately, the aim of all this work is to understand the contribution of these glaciers to sea level rise both now and in the future.
This is not a frivolous question. In fact, if large (more than a couple of metres).of sea level rise is expected, it is a question that is basically existential for Denmark.
I will add more on the specifics and science in coming months, this is already long enough. However, I’d like to mention a couple of other points:
Firstly, DMI is by no means alone operating up here. Many of the key articles, particularly on glaciology in this region, have been written by the Japanese group at Hokkaido University and their collaborators at the Meteorological Research Institute, the national institute for polar research and others. We at DMI are also working directly with the Greenland institute of natural resources, Asiaq, GEUS, KU, DTU, AU, SDU, ESA, Eumetsat and many others in this research programme.
Finally, this work is currently being carried out under the auspices of the Danish National Centre for Climate Research (NCKF), funded by the Danish Government though with contributions also from other research projects mostly funded by the EU’s Horizon 2020 and Horizon Europe frameworks as well as ESA’s climate change initiative for the Greenland ice sheet.
Inspired by Ian Brooks, a list of all the books I’ve read this year. (Started on twitter and now imported over here to finish it off). It turned out to be many more than I expected in fact and it has been really motivating to keep track – I always have the idea I’m not reading enough but that isn’t really true.
First up Gaia Vince’s wonderful Transcendence: I feel this one rather got lost in the Covid19 mess and it’s *such* a shame. A really beautifully written book on what makes us human.
Second, was a foray into the wonderful world of mosses with Robin Wall Kimmerer. This was a book I enjoyed so much I bought a second copy to lend to a friend as I didn’t want to lose my own copy.
Third, and staying with biology, Merlin Sheldrake’s Entangled Life, a book I enjoyed, but not as much as I expected given the subject is quite fascinating. It felt like there was a bit too much author and not enough fungus. However the dense endnotes more than made up for it. A very cool subject and really a good introduction. I could have used a bit more technical content though.
Four was a return to a book started long ago – I finally finished Gabrielle Walker’s book Antarctica, right before a field trip to Greenland. A really great book, full of excellent science and details that show a real love of the continent – though note a few reservations about an infamous scientist who features heavily in the book in the second tweet.
Five: Explaining Humans by Camilla Pang. An unusual book, I would never have chosen this if it hadn’t been for the Royal Society science book prize and that would have been a loss. Really brilliant insights into how some neurodivergent people see the world and at the same time a great introduction to science. Huge recommend.
Six: brilliant, funny, horrifying, tragic, sobering. Hard to describe withou sounding overwhelmingly grim, but worth a read: “This is going to hurt” by Adam Kay
Seven: as I originally tweeted, I read this in the depths of COVID19 fever, and I don’t remember much about it now unfortunately but the impression of a refreshing wander down the lush Irish river remains. John Connelly’s Stream of Everything
Nine: the final part of Patrick Leigh Fermor’s wonderful trilogy travelling through Europe. A book I could hardly bear to finish, the whole journey was so beautiful ly written about a time and a Europe that has vanished forever. https://twitter.com/ruth_mottram/status/1534655257149677575
Eleven: back to novels and what can I say about this incredible world created by Susannah Clarke in Piranesi? Sumptuously beautiful, you just have to read it. I would never have picked this up but my local bookshop (in Copenhagen!) recommended it and that is as good an argument as any for frequenting my local bookshop in person… https://twitter.com/ruth_mottram/status/1540587959791112192
Twelve: perhaps not the most relaxing holiday read but ultimately hopeful: Kim Stanley Robinson’s The ministry for the future. Parts of it were far too real, other parts perhaps unrealistically utopian (and in the light of FTX what exactly *is* that blockchain thing about?). Nonetheless an important work, and the man himself is a rousing speaker I saw and who signed my book at the bloom festival
Thirteen: the first of several children’s/ young adults books on my list – this is a Danish classic but also translated into many languages now. I find it a fascinating concept: what if someone could see your private shame?
Fifteen: a terrible war ripping through Europe, refugees fleeing the Russian advance and an overloaded ship sailing away through bitter winter weather in the Baltic. Sometimes a little too close for comfort, it certainly explains a lot about our current situation and it’s based on the true but laregly unknown story of the world’s worst ever maritime disaster. This is also YA territory – I read it to assess suitability as a gift for young relatives. It’s extremely well written, though flags a bit at the end. One of those books that stays with you for days after.
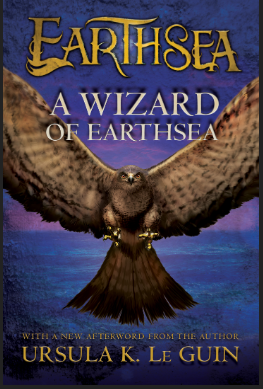
Sixteen: And now we enter territory not tweeted. I discovered eReolen’s international section this year. eReolen is the Danish Library system‘s excellent audio and ebook loan service, and it turns out that via the organisation Overdrive who run the Libby app, you can borrow books from all over the world. A revelation. Anyway number sixteen was the classic Ursula LeGuinn “A wizard of Earthsea, a book I really couldn’t put down. I’m slightly amazed I’ve never read it before. Everything they say about it is true.
Seventeen: again in the underrated classics that I’ve somehow never read category – Howl’s Moving Castle by Dianne Wynne-Jones. I came to this via the Japanese Studio Ghibli animated films and again this was read via eReolen. How had I never even heard of this author even though I grew up in the UK? Really brilliantly imaginative, reading it again to kids as a Christmas book this year.
I almost forgot number 18, which is somehow a little strange as it is a book that directed me from a wavering vegetarian towards veganism. I’m not yet (and may never be) a full vegan, but Henry Mance’s “How to love animals” is a clear-eyed look at the emotions, conflicts and contradictions in our relationships with animals, including dog breeding, slaughterhouses, how to deal.with exploding deer numbers and the ecological cascades that result. Very thought-provoking and although I didn’t agree with everything, it at least helped to visualise and resolve some contradictions in my personal philosophy. This is a good review in the Guardian: https://www.theguardian.com/books/2021/may/01/how-to-love-animals-by-henry-mance-review-the-case-against-modern-farming
Update: if you’ve arrived here from Twitter – or even if you haven’t – welcome, pull up a chair, have a seat and a read around the subject of this post: the fediverse – the online ecosystem where distributed servers can talk to each other…
It’s become clear that this post is rather popular as newer people are finding their way to mastodon, and, perhaps, dipping a toe in. It’s also I think become clear just how empty science twitter is becoming, and how much more interesting mastodon is. At the same time, having been freed from what Cory Doctorow calls the walled garden (go ahead, read the article, I’ll wait), I’m very reluctant to enter a new one So I hope the following is helpful, feel free to leave comments with other hints and tips. And, Welcome to the fediverse…
I’d originally been meaning to write this post for a while but never quite got around to it until new rules on the birdsite made it quite likely that my account would be suspended. In the end that did not happen, but by then, I’d already been snared by the mastodon…
UPDATE: The tweets by @TwitterSupport this morning, announcing a new policy banning linking to competing websites, have been deleted.
The policy itself was deleted from Twitter’s website.
However, I have been preparing for a relocation and I have been cross-posting from mastodon for a while. Note though that clicking on a mastodon link in twitter will bring up a potentially unsafe warning (which is nonsense of course), e.g. clicking on the link to my mastodon handle in my twitter profile page shows “Warning: this link may be unsafe”.
It has become increasingly clear that the new owner of twitter is more interested in preserving and fortifying his walled garden than in opening it up as a true public square. In fact, I had felt that over the last few years my interest in being there has waned. I’m not the only one. Mastodon has been a breath of fresh air.
Those of you escaping to Post may need to consider which is the frying pan and which is the fire.
Meanwhile all the BS about mastodon being difficult to use is just that. I’ve had more and better interaction on mastodon in a month than I had in the last year in twitter. pic.twitter.com/QnpRivZqHm
On this point there’s not much I can add to what others have said. I had not actually expected the sale to go through, when it did I did not expect things to go so alarmingly haywire as fast as they have. There has been great benefits to me personally as well as to countless activists and orga organisations with being on there but the reinstatement of blatantly abusive and bigoted accounts, the bizarre banning of journalists, and finally the rule against posting links to external sites strongly the suggest the show is over. We have alternatives now..
I have been on mastodon for a couple of years but only revitalised my account a month or so ago. Massive thanks in this to Victor Venema who persuaded Frank Sonntag to set-up fediscience.org and then persuaded me to join it. A form of fixing the roof while the sun was shining you might say. And as more people have joined it’s really been a lot more rewarding. It’s different to Twitter. It’s not a full replacement. I intend to post here more often too. (Especially as the tools to do so quickly and easily via my mobile phone – a fairphone 4 – have really developed over the last year or two.)
But after today I will not be posting on twitter directly anymore. I may drop by from time to time to check out what’s going on. I will instead be hanging out in the fediverse.
You can find me on fediscience.org for science and various other nonsense, on helvede.net for danish language chat, on pixelfed.eu for photos and pictures and of course here on sternaparadisaea.net for blogs.
The last few weeks in the fediverse have been invigorating. I’ve been participating and creating more rather than passively consuming, expect some changes here on my much neglected blog too in the near future.
And finally here are some tips for getting the most out of the fediverse:
1. Follow lots of people. And I mean really, follow a lot. You need to make you own timeline here, there is no algorithm doing it for you.
2. Boost more than you think you need to, including reupping your own posts to catch different audiences at different times of day (it’s like twitter before the algorithm became so dominant).
3. Create lists of your favourite accounts so you don’t miss anything. I end to use these more than my home timeline in fact. For example I have one for “climate science”, one for “media orgs” + one for “friends. I check in with different lists at different times of day.
4. Follow hashtags to find good content and new accounts that interest you. As an example I follow #Birds, #Ukraine #mosstodon + #SeaLevelRise among others. Some user interfaces (e.g. Halcyon.social) allow you to read these in the same way you would on tweetdeck. Sprinkle your posts liberally with hashtags too.
5. Try out different apps to find the one you like best. I have been mostly using Tusky but I’m now testing fedilab too. On the desktop using halcyon.social gives a very twitter like interface which is appealing.
6. Put in some effort to curate your own experience in the early days. You’ll need to work at it the first few weeks to find good accounts, hashtags etc to follow. Don’t expect everything to be served up on a plate, it’s different here. But I like it a lot..
7. There are masses of tips and helpful articles online, try following e.g. feditips for more suggestions.
8. Use debirdify, movetodon and/or other programmes that are around to help you find people you know from the birdsite. There are already a lot of resources to find earth scientists and other academics, as well as journalists – which also have a form to add yourself in some cases. I am for sure missing a lot here too.
9. Write an #introduction post with hashtags of your interests. This will help new people find you. Browse the #introduction on your instance to find other people to follow.
10. Mastodon works best if you engage with other users – fill out your profile so people can see who you are/what you’re interested in. But remember privacy – and that this platform as a refuge for people who have been hounded off other platforms. Use content warnings liberally and don’t forget to insert Alt-text on images you post. Also use #CamelCase on your hashtags to help people using screen readers understand what you’re posting.
I’ll update this post as I think of things, feel free to also post helpful stuff in the comments or as replies to the post on the birdsite or on Mastodon…
Although I’ve had an account on mastodon since 2017 it’s only since the great Twitter migration that I’ve been using it and – I like it! (You can find me there as @ruth_mottram@fediscience.org )
I definitely don’t see it as a like-for-like replacement to twitter, what I miss from the bird site (as the denizens of the fediverse refer to it) is the breaking news (though even that seems to be under threat). However, when it comes to useful information, new tools, papers, in-depth discussions on scientific interests, Mastodon is winning every time, certanly compared to twitter now. It reminds me very much of how the birdsite was in the early days (though I’ve only been on since around 2011). It requires a bit more work to find the good stuff, and I may write something about that soon.
Anyway, an interesting discussion arose this weekend that I want to document and book mark here. Last week at work, our research group had a discussion about subscriptions and literature searches, specifically in relation to the costs of Web of Science, google scholar and connected papers.
Screenshot of an example search on connectedpapers.com where a paper looking at ice melange at Sermeq Kujalleq (Jakobshavn Isbræ) is the starting point
Back on mastodon and suddenly the suggestions came pouring in! In particular Nika Shilobod has some intriguing suggestions visit the link to click on them all.
In Mastodon you can bookmark posts, so I have saved this one for future reference as I start to build a reference library looking at ice melange for my next paper. The issue has an extra relevance as the extortionate fees that publishers charge libraries is now starting to have real effects even in rich countries like Denmark where we were recently warned that we may lose full access even to very high profile journals Nature unless some reasonable agreement can be made between the universities and the publisher. (This article in the guardian is particularly eye-opening on how we got here!)
As a result I found these particularly useful links:
So all of this pretty much confirms my initial impression of mastodon, and indeed the fediverse in general – there’s an enormous amount of good stuff out there, and this seems liek a really good way to find it.
The summer period is traditionally a time to get a lot of work done. Perhaps it’s a bit paradoxical that just when the weather is at it’s nicest I shut myself away inside and start coding, compiling, pre and post-processing and analysing data. It’s also of course the time when the office and my meeting calendar is (usually) at it’s quietest. July is the holiday month in Denmark, most of my colleagues seem to take 3 weeks off and I have become accustomed to the same. It’s incredibly important and reviving to take the time off. I always come back re-energised and revitalised, and this year I feel like I need it extra much. In late July, the BBC starts to broadcast the Proms concerts from the Albert Hall and it’s perfect music to listen to while coding.
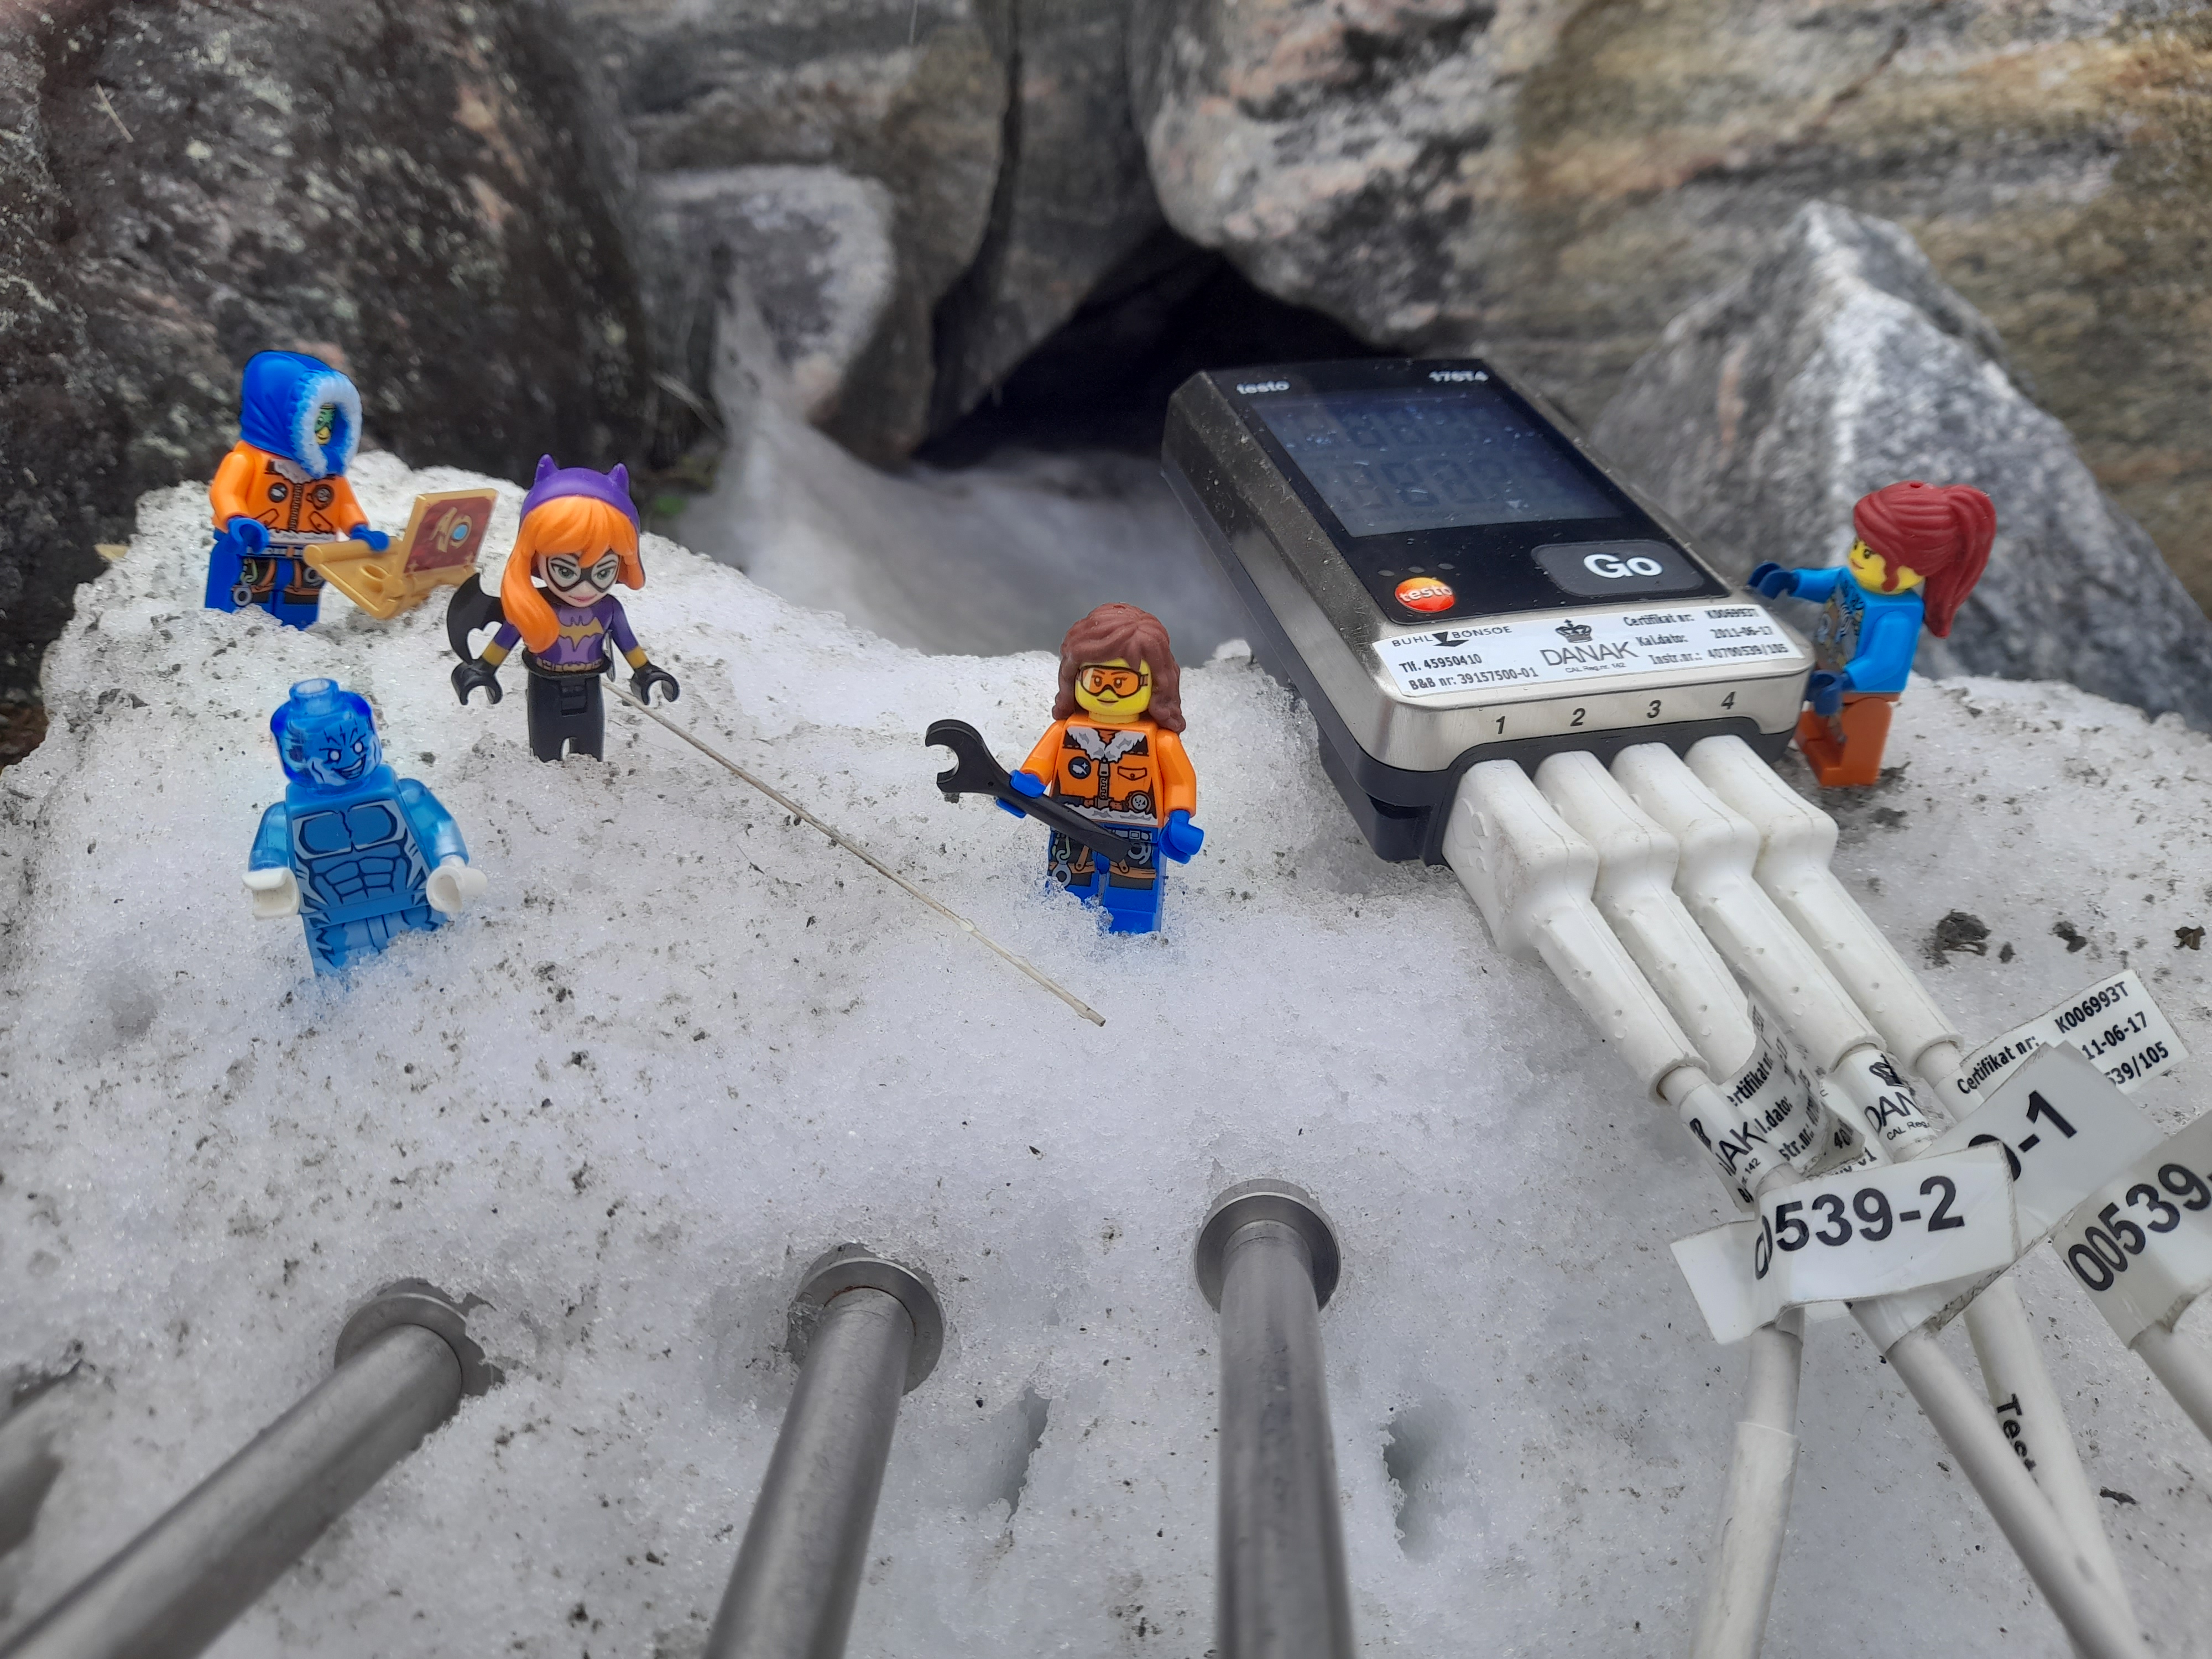
Testing equipment prior to field studies at Qaanaaq in North West Greenland this year
After several years of general overwhelm (and if I’m honest a small side-helping of procrastination), I finally have a long-awaited paper coming out on Antarctic Surface Mass Balance and a model intercomparison, hopefully in the next few weeks. Then there is a proposal as part of a Horizon Europe consortium in progress and preparations for our newly funded Horizon 2020 project PolarRES – due to start on the 1st September. Finally, the data we collected in Qaanaaq as part of the National Center for Klimaforskning (more on these projects in a later blog – hopefully!) needs to be processed, analysed and put to good work.
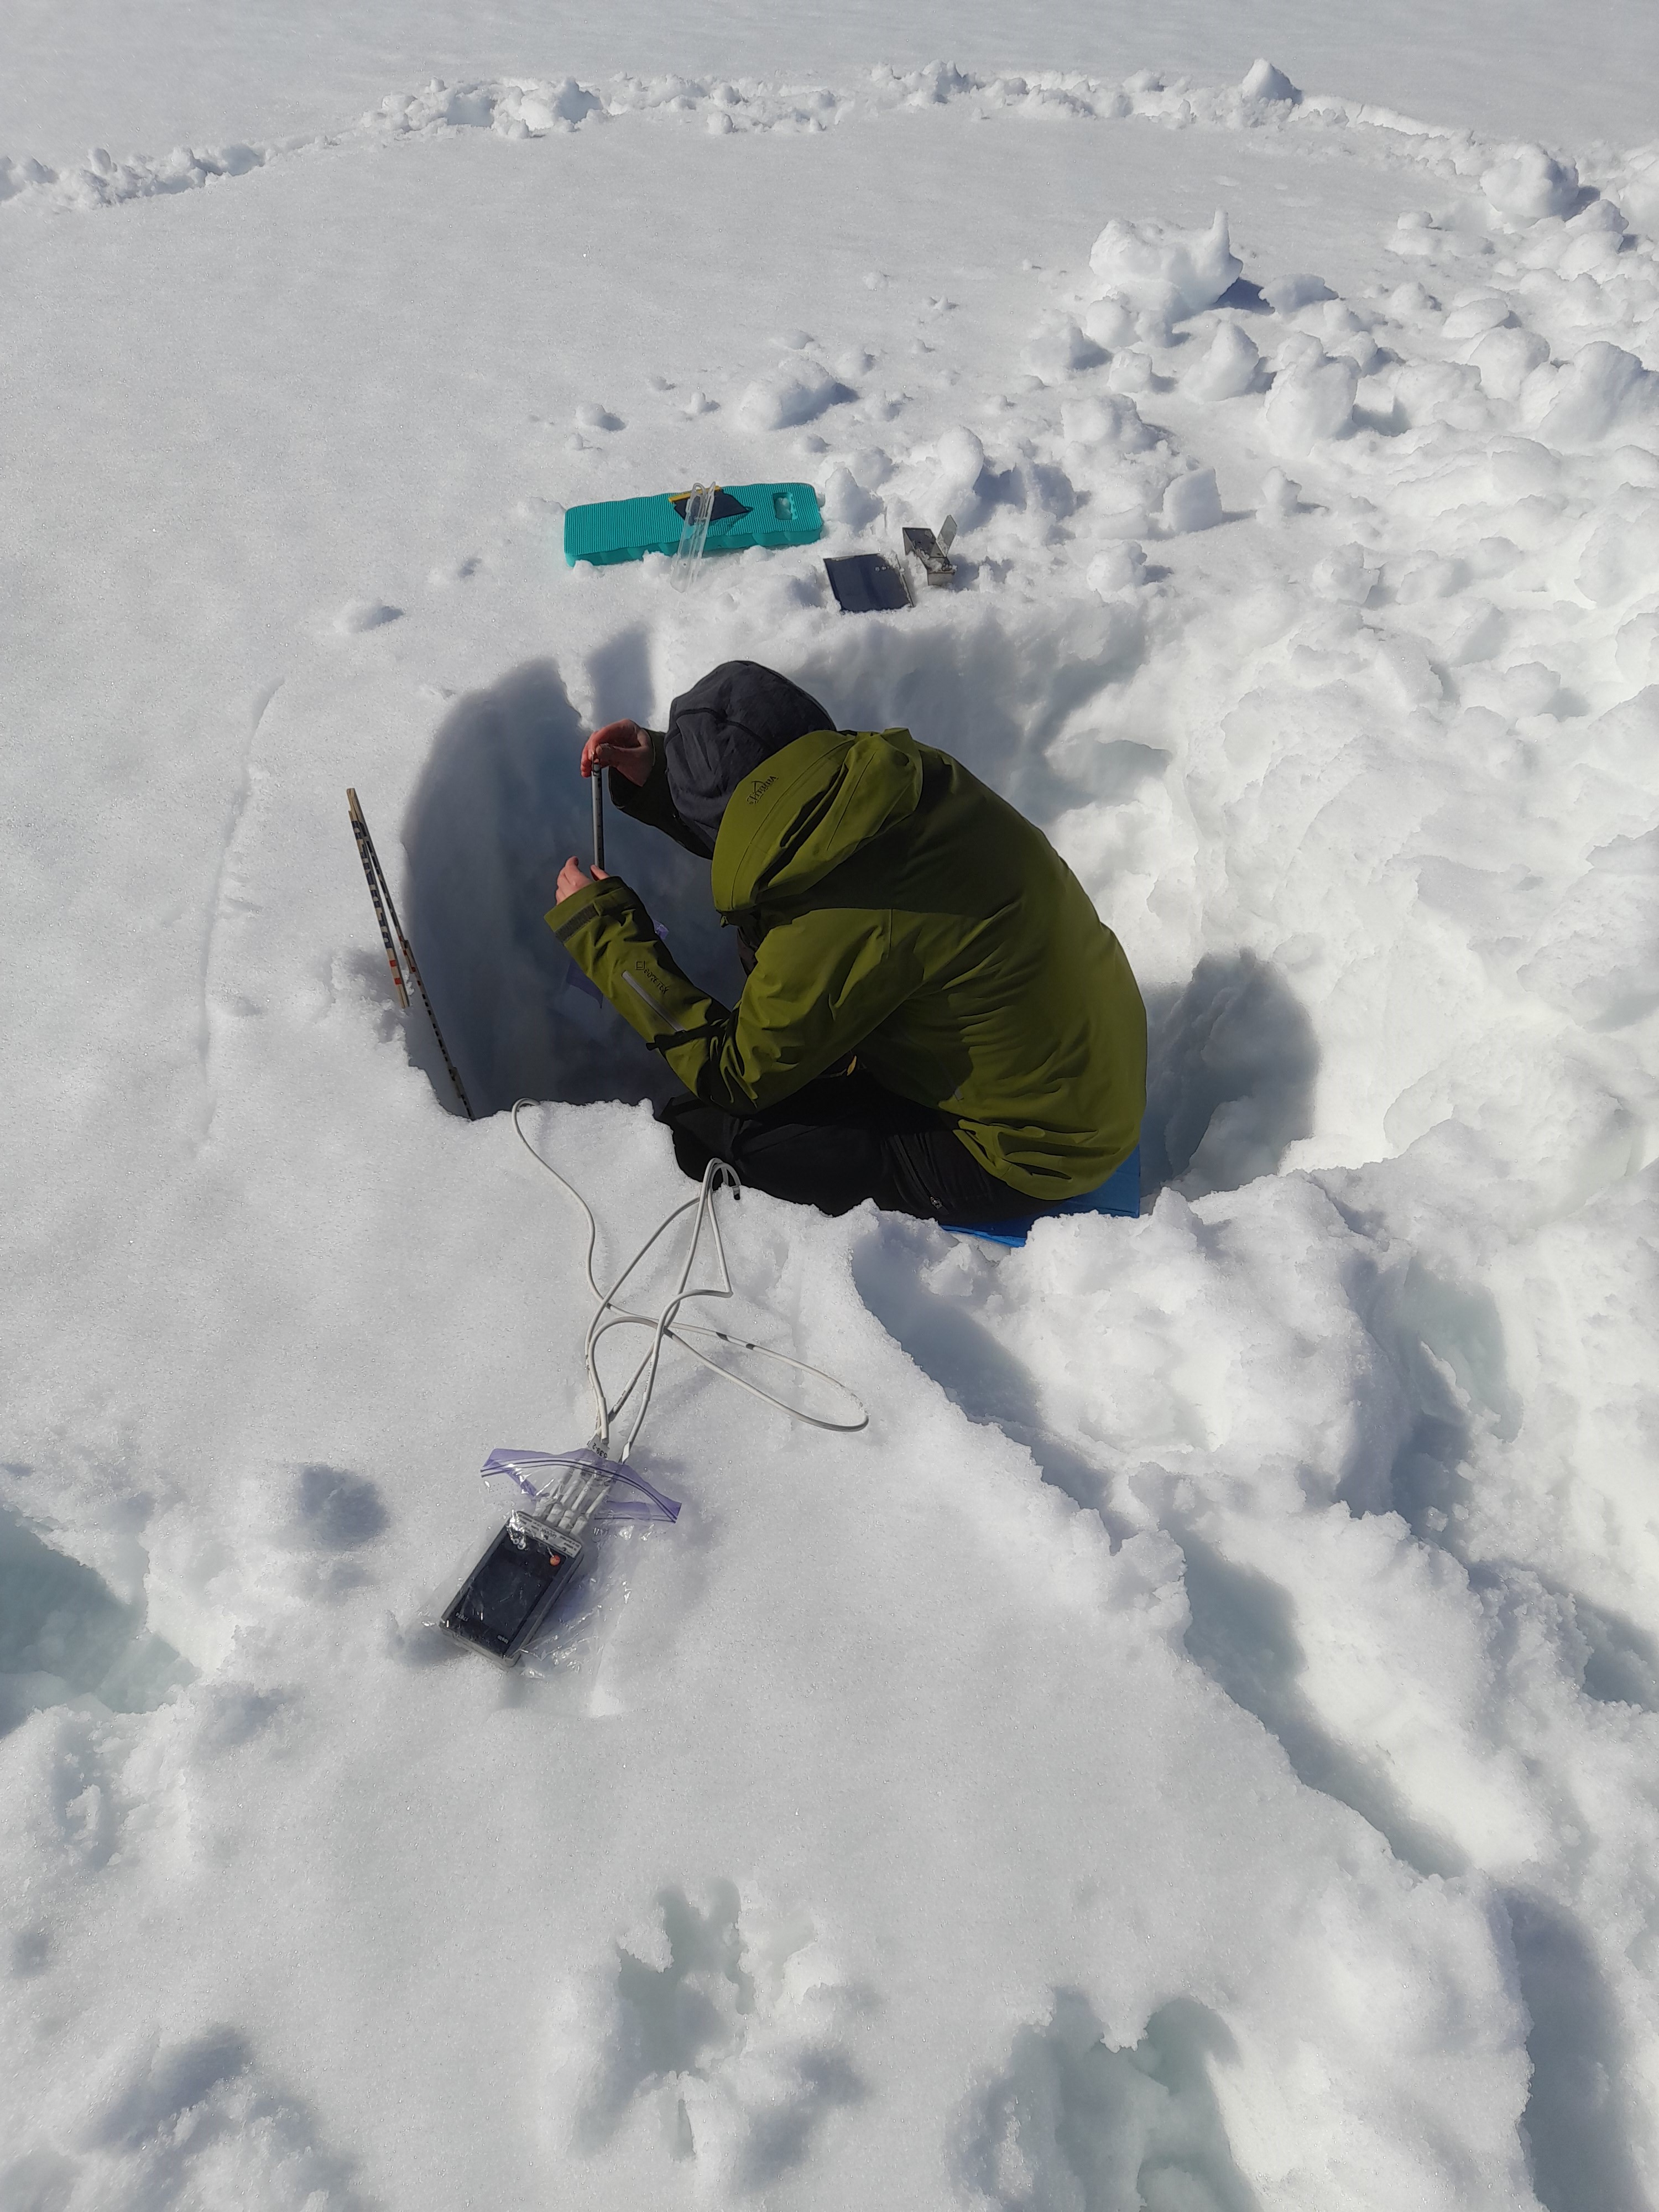
My DMI colleague Andrea Gierisch measuring snow density in a snow pit on an outlet glacier from the Qaanaaq ice cap, I was scribe!
There are several other papers coming out shortly on which I am a co-author too, so, busy times.
I very often take a break from social media at this time of year too (not always!) and so it is this year. I have an extra long summer holiday this year as I have some old leave to use up and although I find myself working the first week, I intend to use the rest of the time to reconnect with the family. I have also been finding it increasingly hard with a fractured work day and many many different commitments to do the focused work that I enjoy so much. I’m slightly reviving this blog for a bit more detailed engagement and stepping back a bit from Twitter for the summer. I don’t promise to not check in at all. but you won’t see me around much!
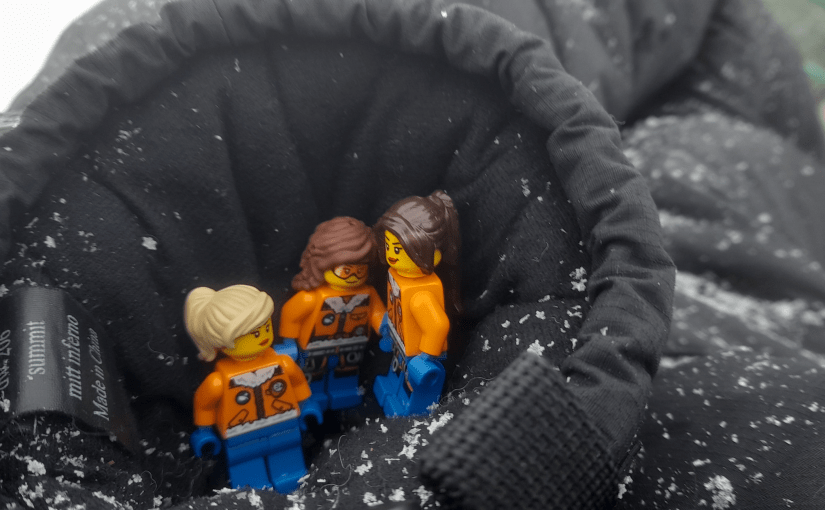
One thing I will be finalising is the Bat Girl and Ice Man comics I made for my children while I was in Greenland this year – some reformatting and the remaining translation into Danish is still required so I will be using the train trip to the mountains this year to do that. Many thanks to Andrea especially for proof-reading and ideas and also to Steffen and Marianne as well as our friends in Qaanaaq, Gustav, Peter and Qillaq for being models in the story!
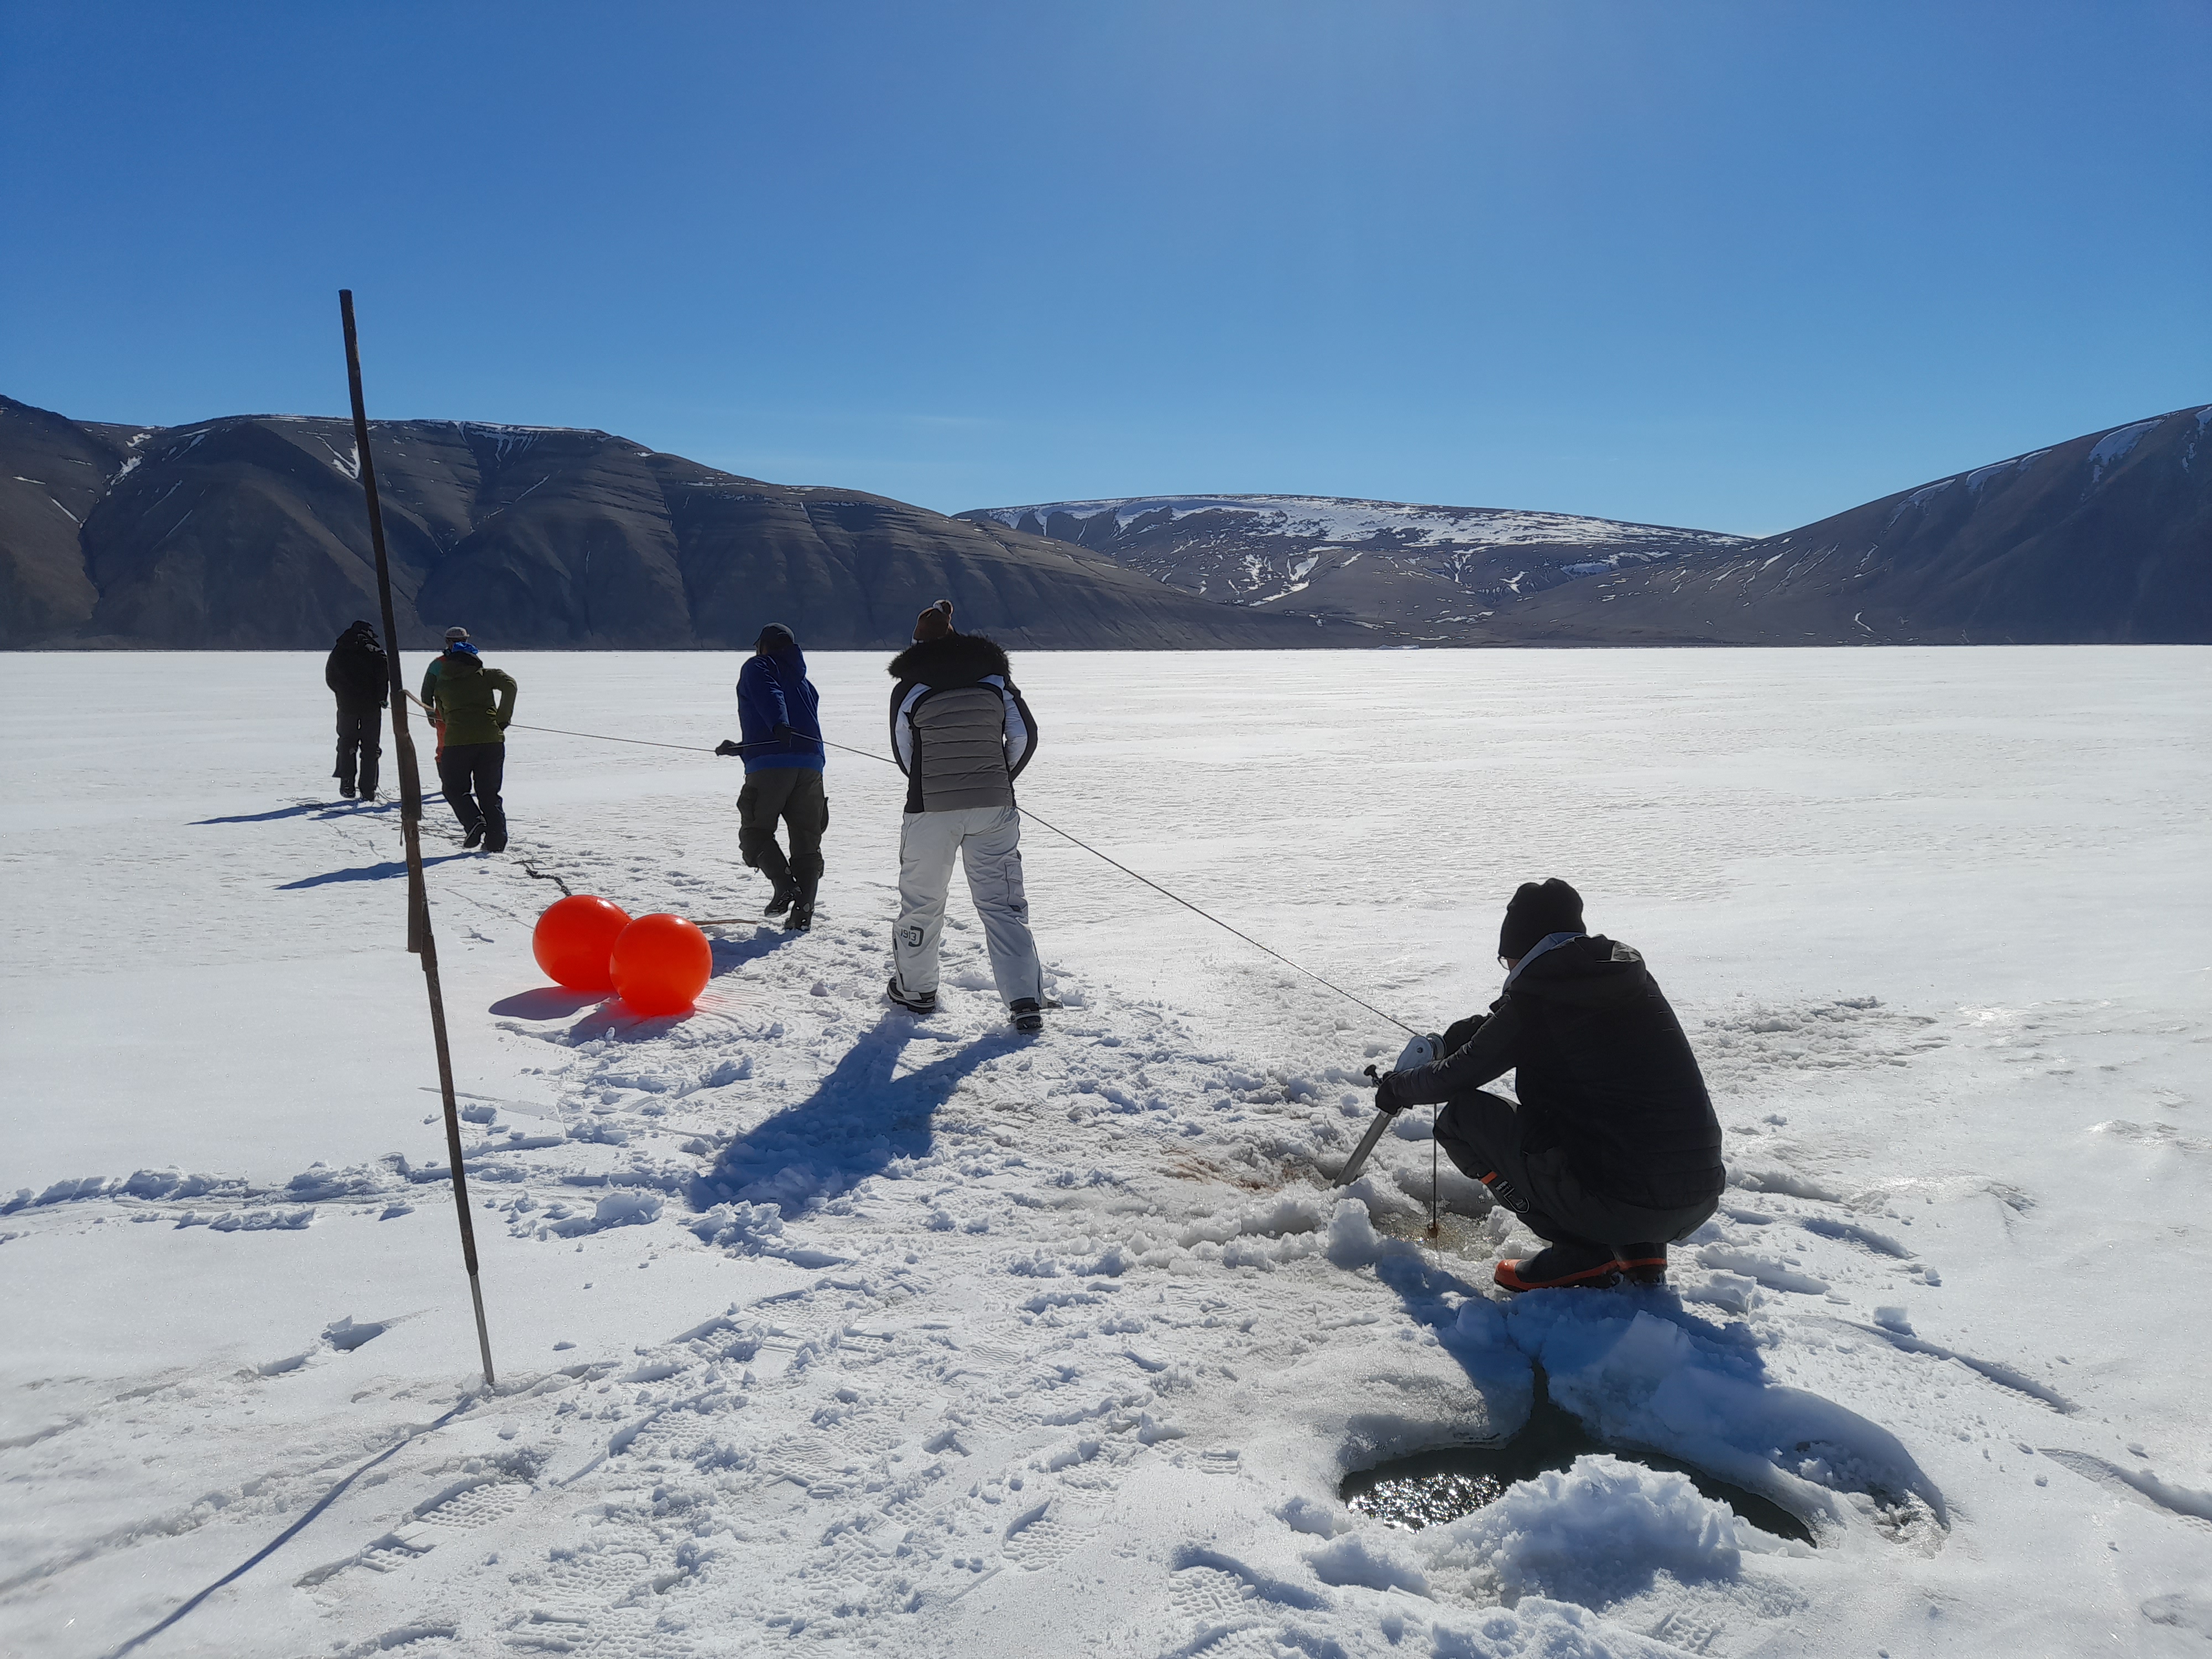
Pulling up a mooring from 1000m of water is hard work and a team effort, south side of Inglefield Bredning
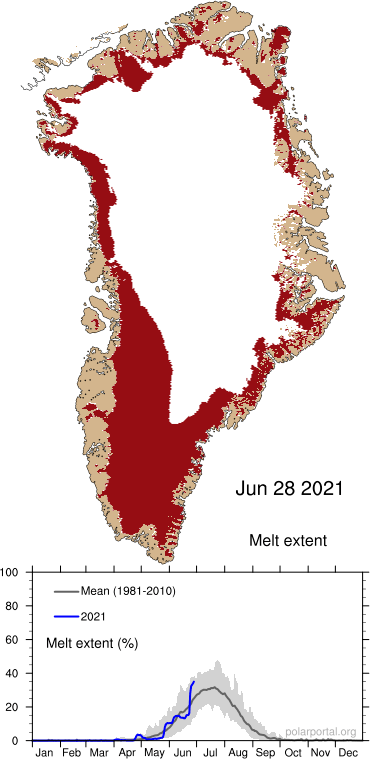
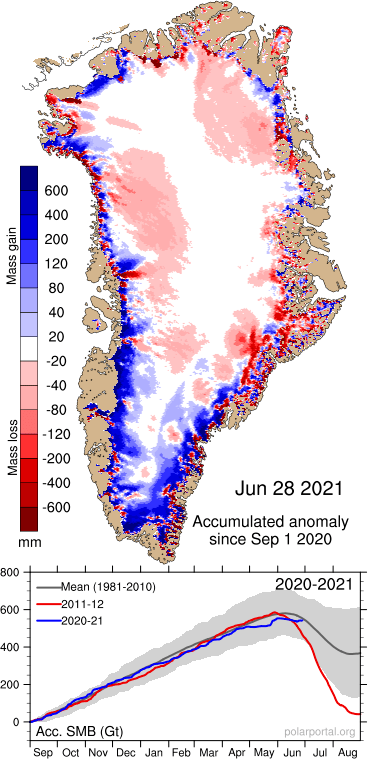
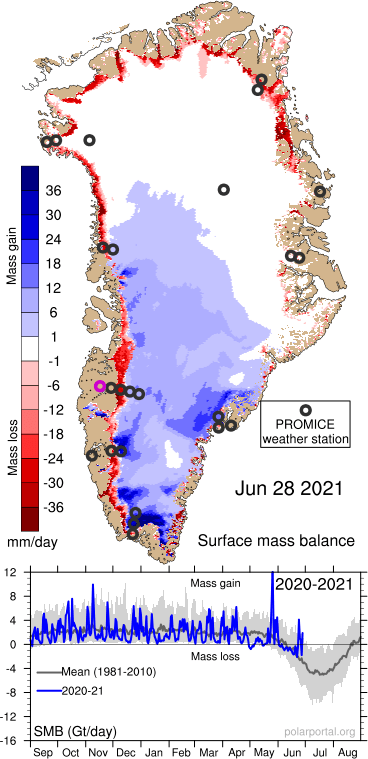
Of course, the machine keeps on rolling forward. The Polar Portal is still online and working well with full near real-time information on Arctic cryosphere and the Greenland ice sheet surface mass balance. The melt season is in full swing, and melt area is pretty wide, but the losses have been balanced to some extent so far by late spring snow and rain on the ice sheet – a reminder that we always need to remember a large amount of the melt refreezes in the snow pack.
Anyway, this is basically a long post to say, see you in mid-August and take it steady…
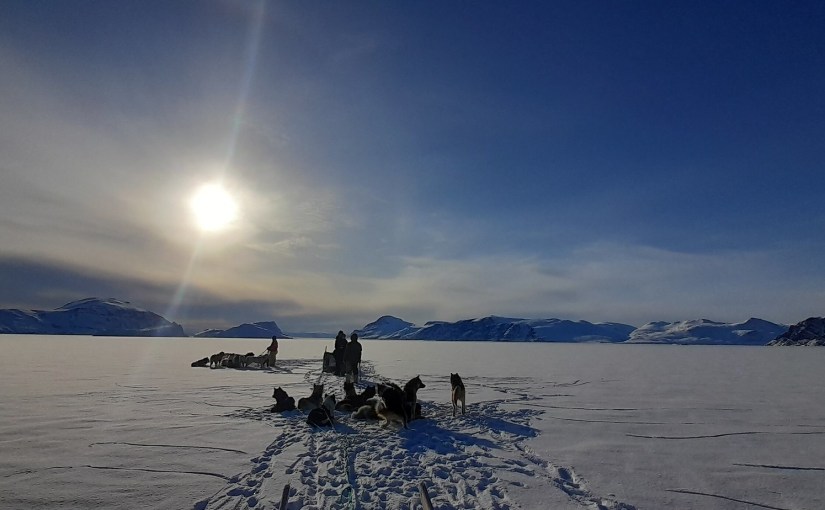
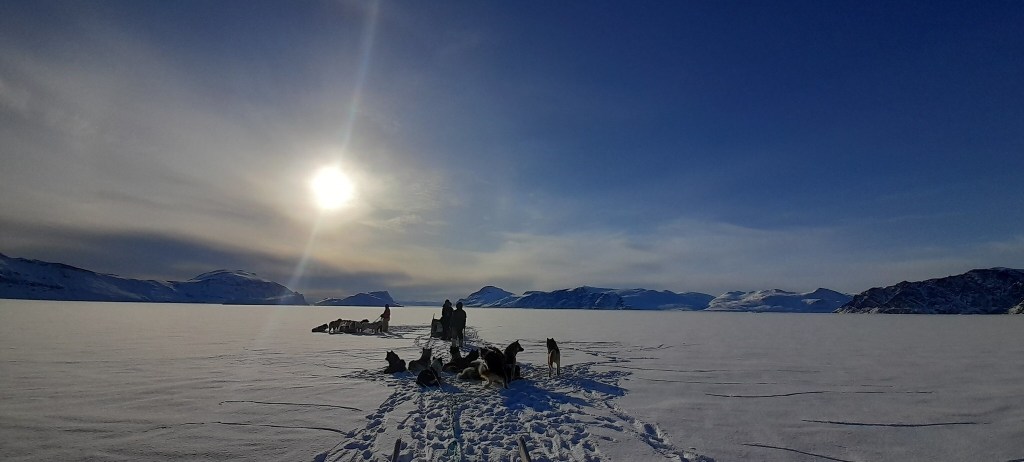
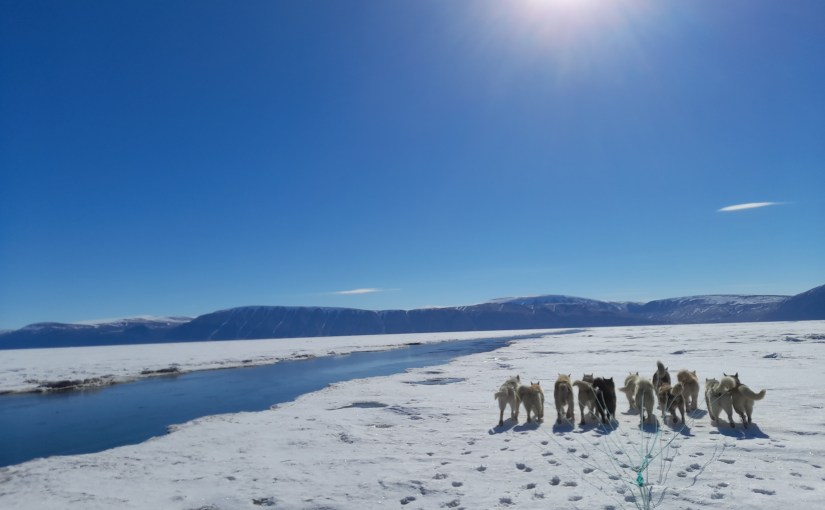
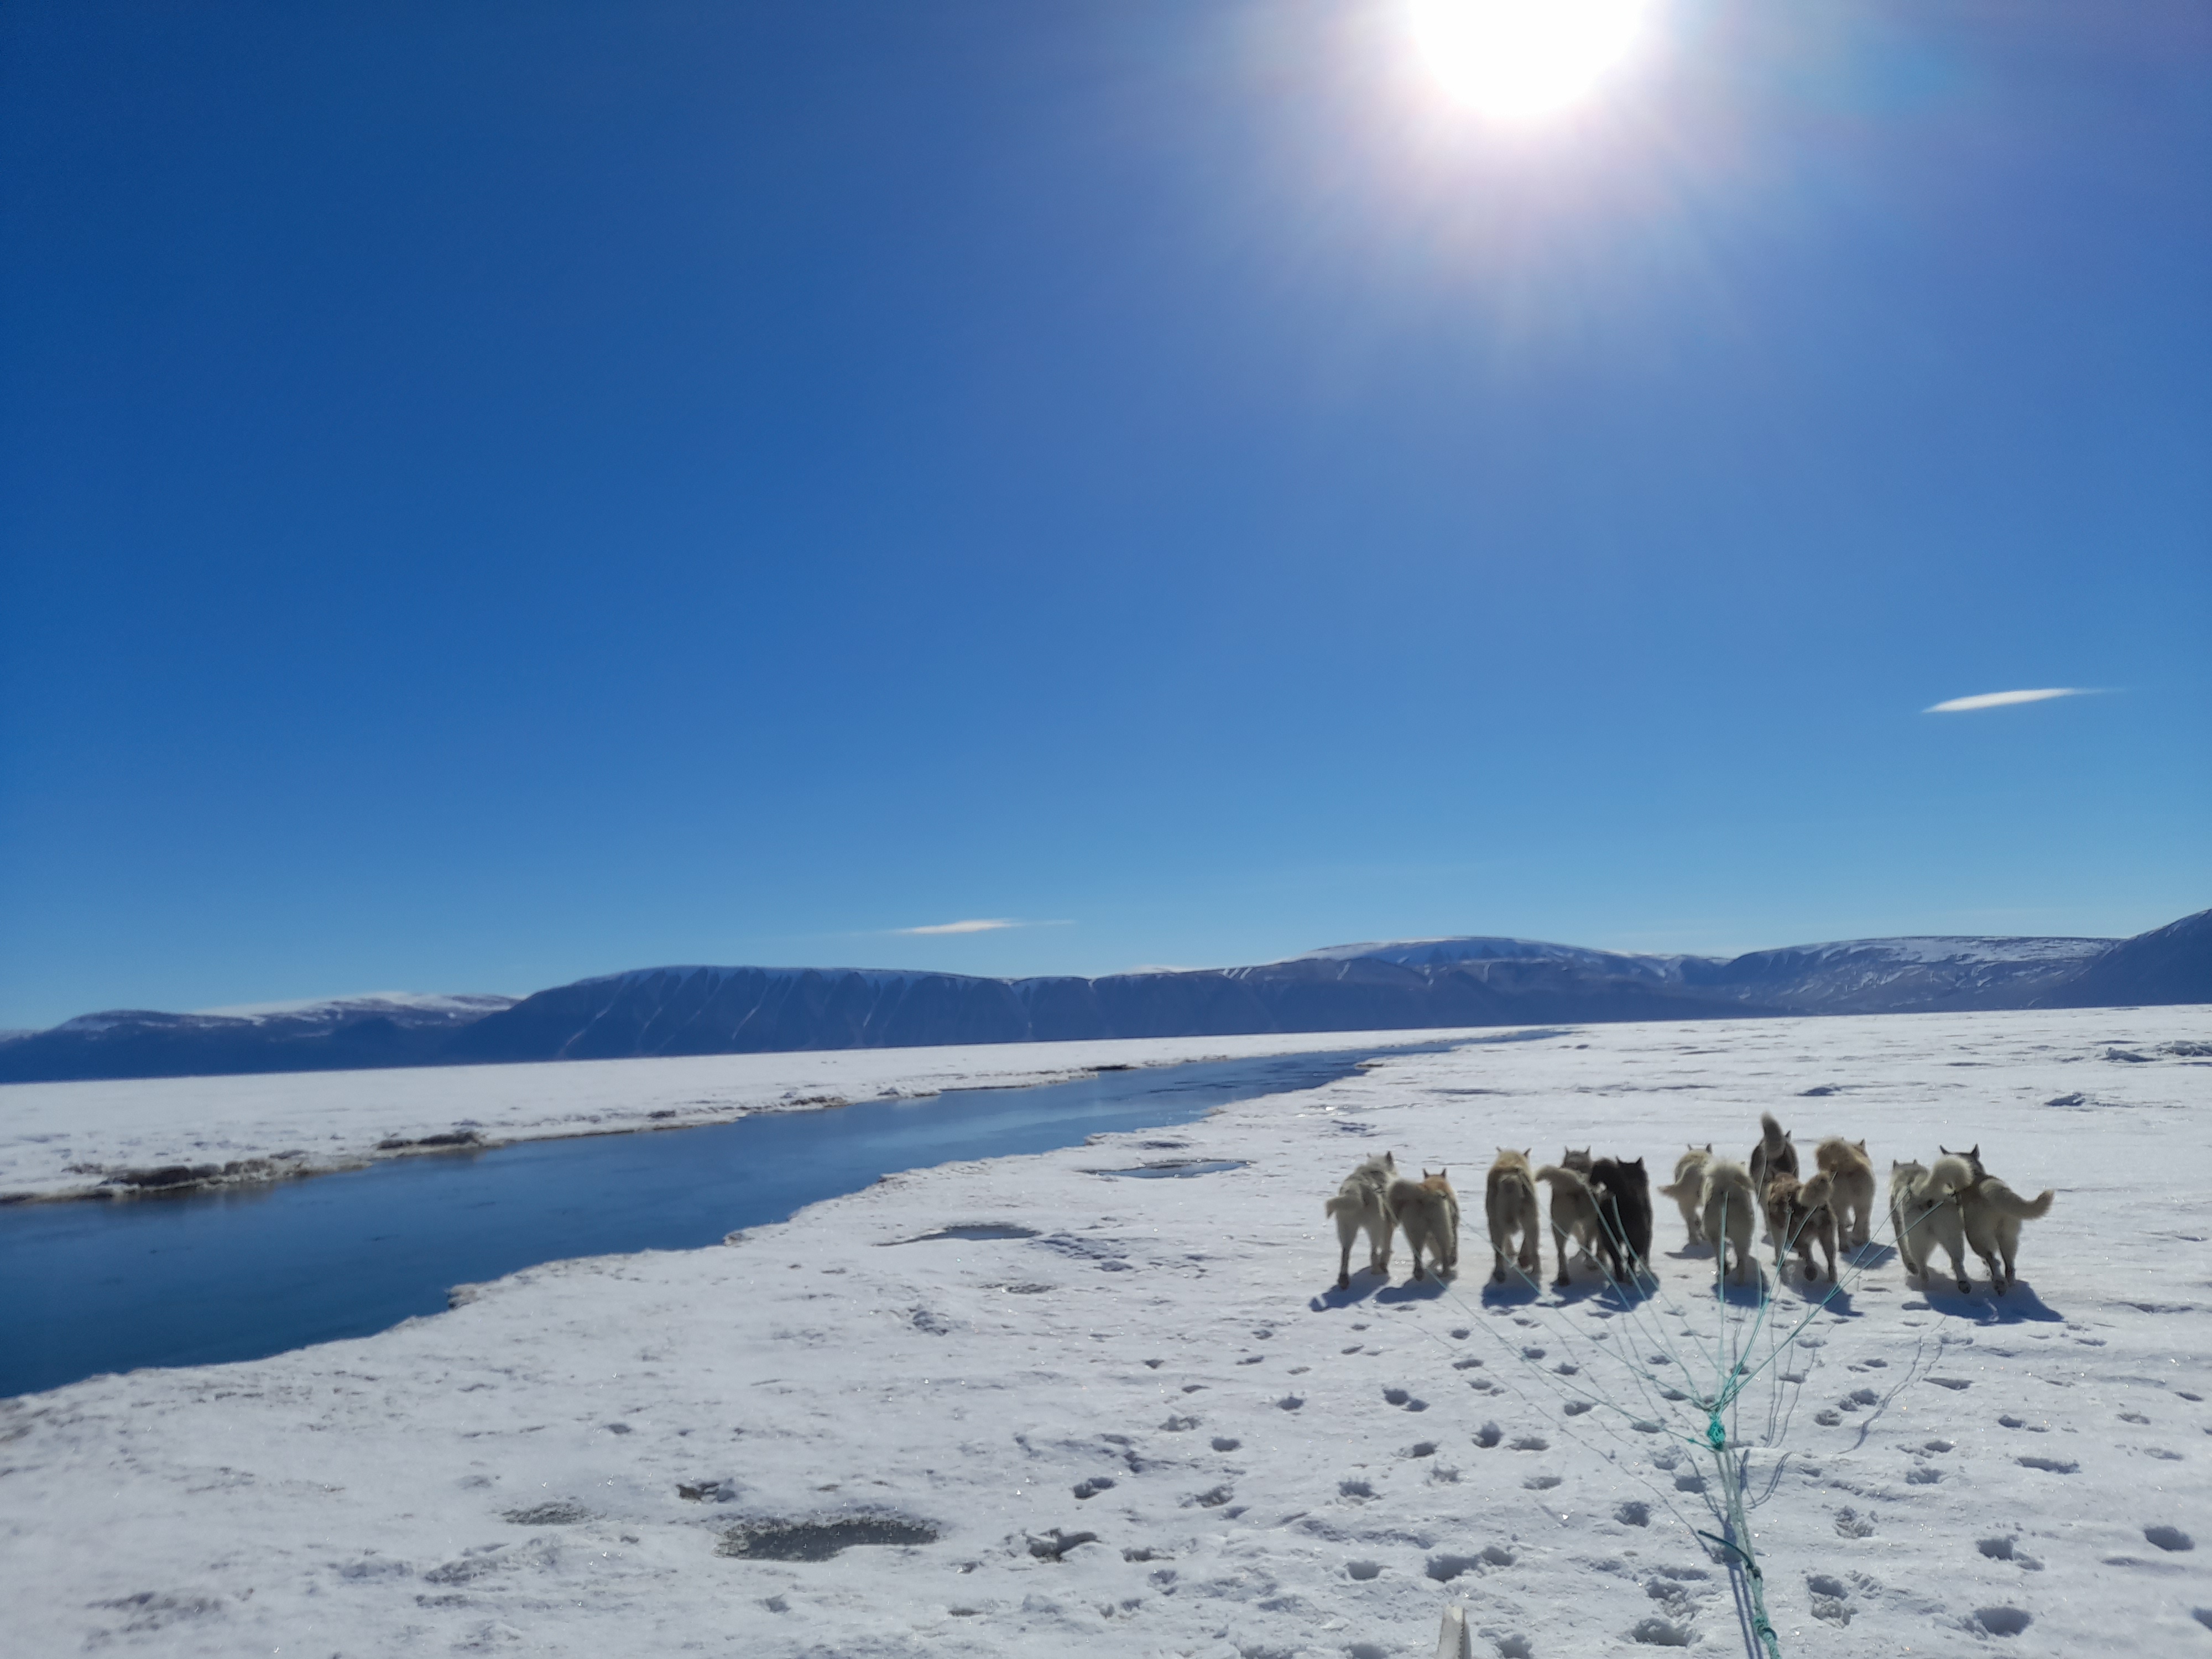
Sled dogs on the sea ice of Inglefield Bredning, alongside a sea ice lead that forms each winter season at this point.
Ice2Ice is a large project funded by the European Research Council in a Synergy grant. It is one of my current main sources of funding and is a pretty exciting piece of work, looking at abrupt climate changes in the past (when the temperature around Greenland suddenly increased by around 10-15C in about a decade) known as Dansgaard-Oeschger cycles. Go and check out the webpage and also this very nice overview on science nordic including cool film showing ice core processing .
Glaciers in Greenland lose mass by melt and runoff, by calving and by submarine melt that happens at the front of outlet glaciers that terminate in the ocean. Submarine melt occurs because the ocean water is (relatively) warmer than the ice, but it goes much faster where there is turbulent water mixing the layers by the glacier. Probably the most important source of turbulence are plumes of water that emerge at the base of the glacier where it terminates in the fjord. Penny How, a scientist at the University of St Andrews recently wrote a very nice blog post giving an overview. Including this nice GIF showing a very clear plume coming out the front of Tunabreen, a glacier in Svalbard:
Note the dark coloured water (indicating high sediment concentration) coming out the front of Tunabreen in Svalbard – Image by Penny How
The water is generated by melting mostly at the surface though also at the bed of the glacier. Meltwater flows like rivers through systems of englacial channels to finally arrive at the bed where it makes its way, eventually, to the end of the glacier.
Unfortunately these channels are pretty hard to map, and there are lakes and areas at the bed where water can be stored. The plumes themselves are rather hazardous to observe as they are often inaccessible and in front of actively calving sections of the glacier. There have been a few studies, but often these are snapshots in time and it is difficult to assess how important these processes are to the overall mass budget of the ice sheet.
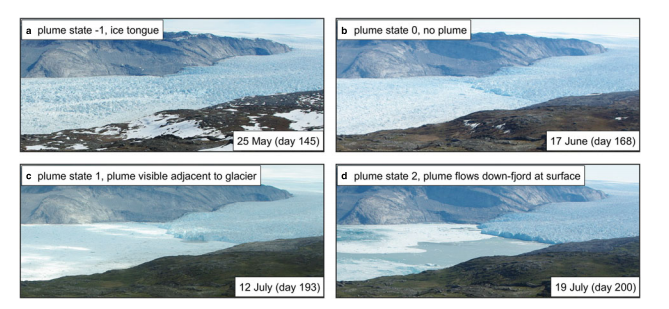
The modelled runoff was used in two different models of subglacial plumes, including one implemented in MITgcm, in order to determine what configuration of subglacial hydrology and plume distribution along the ice front was most likely. The models were compared with a time lapse photos of the ice front showing plume activity at the surface.
Illustrations of plume state classification. a) Plume state = -1, ice tongue present. b) Plume state = 0, no ice tongue and surface expression of a plume. c) Plume state = 1, plume visible adjacent to glacier terminue but is contained within a few hundred metres of the trerminus. d) Plume state = 2, plume visible and flows down-fjord at surface for a number of kilometres.
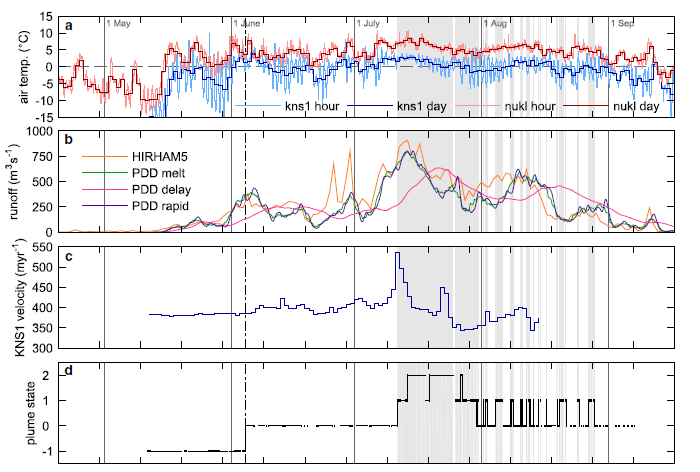
For a large proportion of the summer, the modelled catchment runoff greatly exceeds the discharge required to create a plume that would reach the fjord surface, yet there are extended periods when there is no plume visible from the time lapse pictures. This can only be explained by the runoff emerging into the fjord in a spatially distributed fashion. In the paper we therefore argue that subglacial drainage near the glacier terminus is often spatially distributed, formed either from numerous point sources of subglacial discharge, or a single but very wide subglacial channel or possibly a complex combination of the two.
There are two implications from this work. Firstly, a more spatially distributed submarine plume gives a higher total melt than a single concentrated plume but this melt rate is still unable to explain the mass loss at the terminus when considering the ice velocity at the terminus, suggesting that calving is still the most important mass flux term at this glacier. Secondly, the modelling study found that the distributed hydrology, suggested by the results leads to a more direct ice flow response to high surface melt rates and this response most likely scales with catchment size.
Probably the most important result to come out of this study is that longer time series of observations of plumes, in combination with the modelled runoff lead to a dramatically different understanding of key processes within the fjords when compared to those suggested by simple snapshot observations in earlier studies.
a) Air temperature from KNS1 and NUKL PROMICE stations b) Modelled runoff. HIRHAM5 (orange) delays runoff using a parameterisation based on surface slope. PDD model (green) assumes instantaneous runoff. PDD delay (pink) uses a transit velocity of 0.05 m s-1 from point of production to the terminus. PDD rapid (purple) uses a transit velocity of 1 m s-1. the green curve has been smoothed using a 3d moving window, the pink and pruple curves using a 6 h moving window. large discrepancies between HIRHAM5 and the PDD model arise due to rainfall events (e.g. days 177 and 181). c) KNS1 daily ice velocity. d) Plume state as described in the picture above.
So, does this matter – well, probably. These kind of studies sprang up in the wake of a paper published by Eric Rignot and friends. They were almost the first to really look seriously and consistently at the amount of ocean-driven melting going on at these fronts in Greenland and they found summer melt rates at a number of glaciers that would indicate almost as much mass loss as from calving rates. Out of this early work, the NASA funded OMG (Oceans Melting Greenland) project emerged, which is currently contributing a huge amount of data that will be very useful – including the bathymetry of many fjords in Greenland which are still in general rather poorly mapped.
This focus is welcome, the ice sheet-ocean interaction is incredibly poorly observed and we are very much reliant on imperfect models. However, our study shows that meltwater driven plumes and melt rates at the front of this glacier is rather a small source of glacier retreat when compared to calving rates or surface melt and runoff. Calving is important because a large amount of ice can be lost very quickly as these bergs show. These calved off the front of the same glacier as in this study but in 2009 when I happened to be in Greenland. the glacier, Kangiata Nunata Sermia was previously called the Godthåbs glacier, after the earlier Danish name for the town of Nuuk. It is also often known by the abbreviation KNS in the scientific community.
If this process is similar elsewhere in Greenland it suggests that submarine melt may be less important to rates of ice mass loss and consequent sea level rise. This is not to say it is not important elsewhere in Greenland, and indeed under climate change scenarios with enhanced melt and much warmer ocean waters making it way into the fjords, this may well change and could potentially become much more important.
The mass of icebergs that are calved from the front of Kangiata Nunata Sermia
In a sense this isn’t that “new” – we’ve known about higher sea levels during the last interglacial for ages and that the global mean temperature was roughly 2C above the pre-industrial global mean. This is in fact one of the reasons for the Paris target (though some scientists speculate that it’s also pretty much already out of reach).
However, the sea surface temperature stuff makes it extra interesting as the ocean is a pretty big source of uncertainty in global climate models and mot models do not manage to reproduce modern day ocean temperatures all that well.
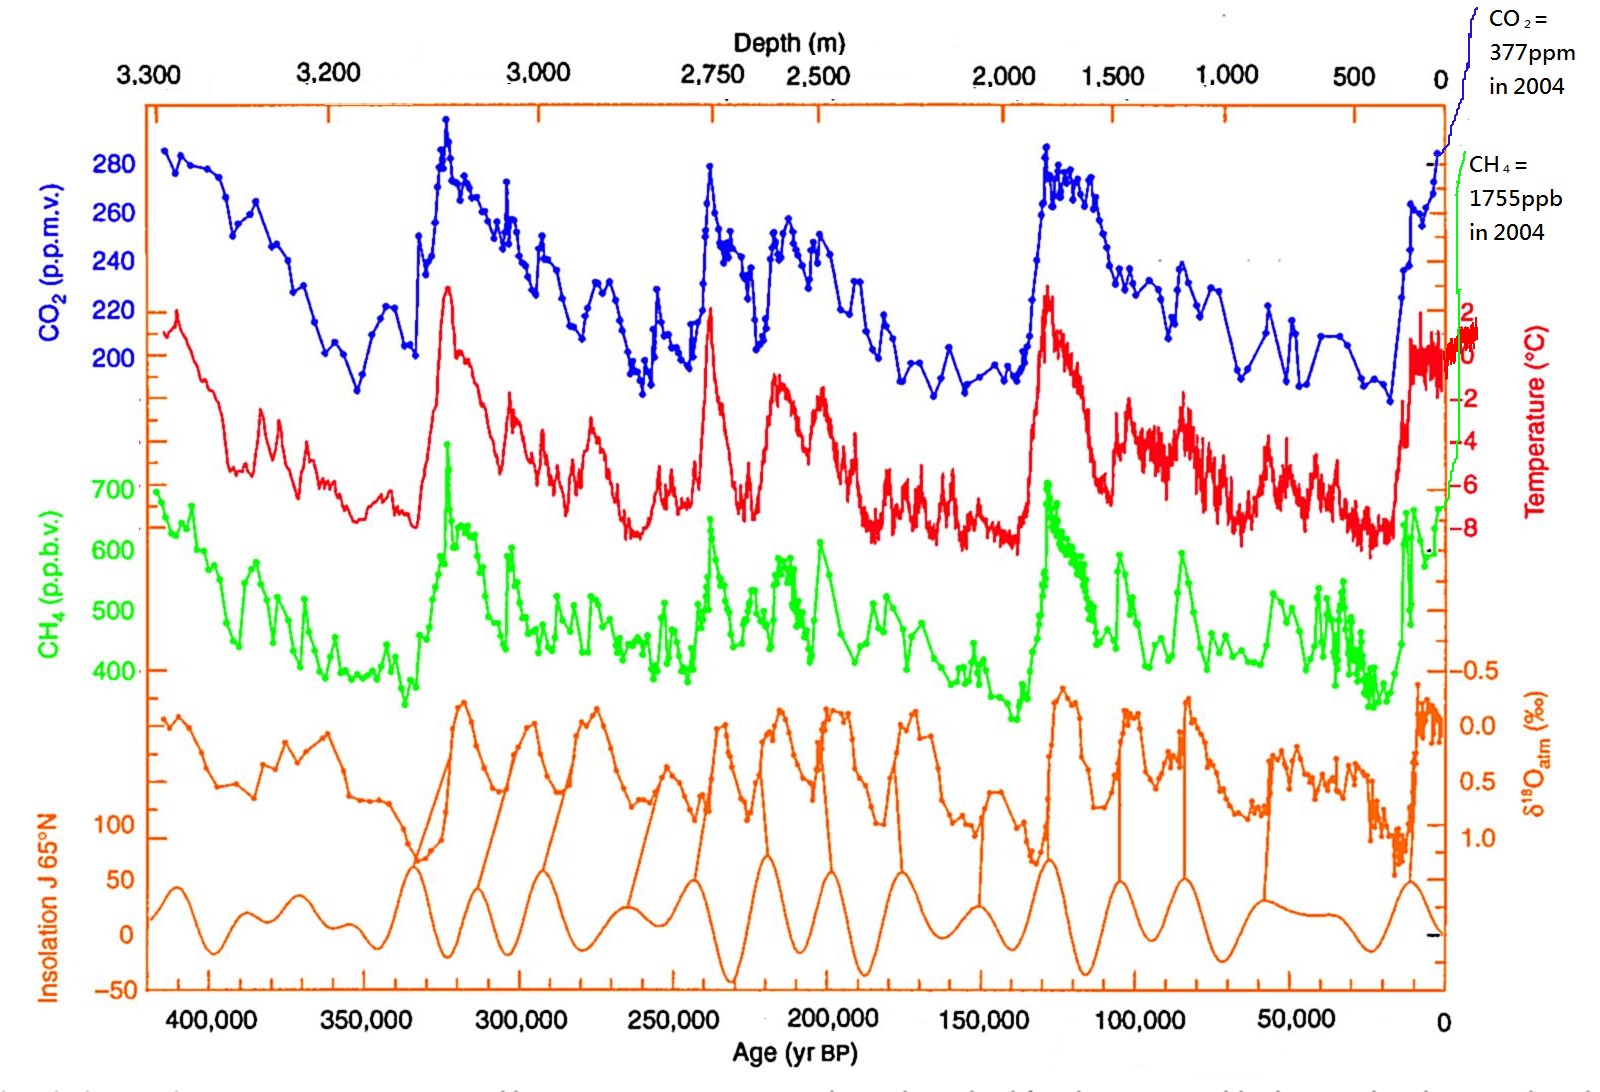
It should also be said that the last interglacial is only a good analogue for 2C world up to a point – it was warm because of enhanced solar input, not because of greenhouse gases as this plot from an Antarctic ice core, edited by the awesome Bethan Davies at the Antarctic Glaciers blog shows:
Carbon dioxide (CO2), Methane (CH4) with reconstructed temperature from the Vostok Ice Core, taken in Eastern Antarctica. Enhanced with modern methane, CO2 and temperature measurements by Bethan Davies. Note that the “modern” value of CO2 here is from 2004. In 2017 it is currently measuring 403 ppm.
It’s also interesting to speculate where the water came from – the Greenland ice sheet was much smaller than today but it was still there and now “only” contains 7m of sea level rise today. So the complete disappearance of Greenland cannot explain the rise in global sea level. The small glaciers and ice caps of the world can’t contribute more than half a metre or so either. Therefore it has to be Antarctica contributing the most – East or West is the question and it really is a very very longstanding question.
The progress in the international polar year (IPY) in mapping the bedrock of Antarctic in the BEDMAP2 brought quite a few surprises, including the discovery of several very deep marine basins in the East that could potentially contribute a lot of water to sea level.
More recently, channels under the floating ice shelves of west Antartica, along with various modelling studies have proposed that the west could be much more unstable than thought. Actually this has been a very very longstanding problem in Antarctic science since at least the late 1970s when John Mercer first proposed the marine ice sheet instability hypothesis.
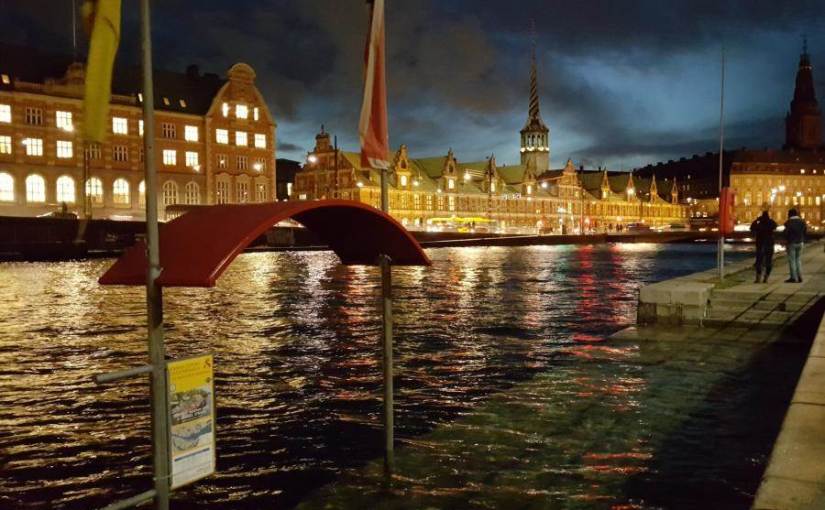
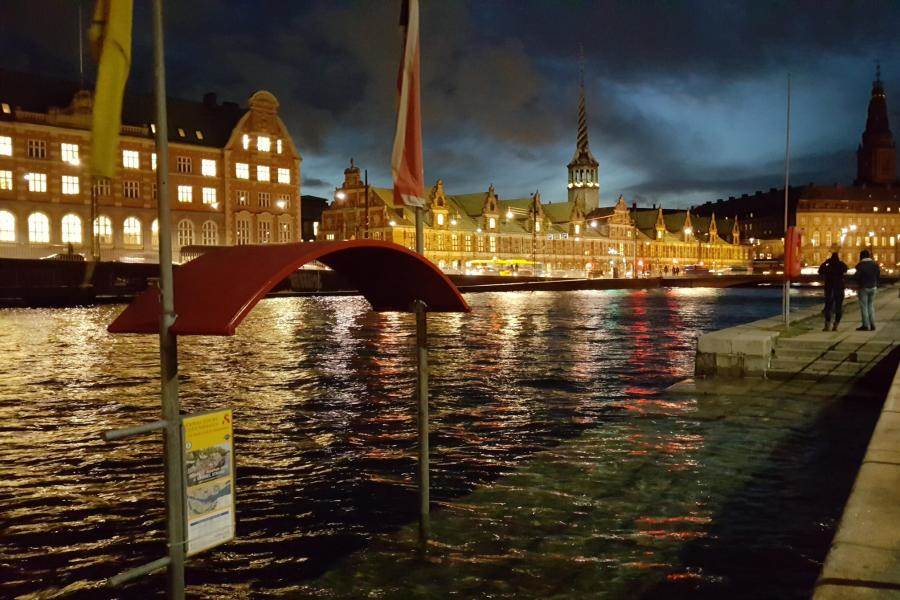
The silent storm surge – coastal flooding in Copenhagen on the 5th January – the water in the harbour is not normally this high! Source: Brian Dehli, shared by DR
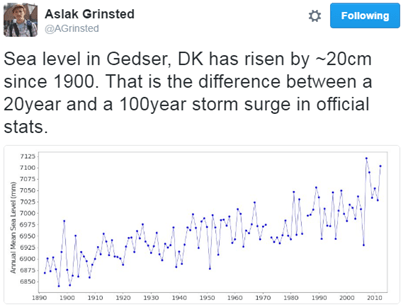
The “silent storm surge” in January 2017 around the coast of Denmark was a hundred year event in many places, but as Aslak Grinsted points out, sea level rise makes a hundred year event a 20 year event with only a small rise.
Sea level will not rise equally everywhere, the fingerprint of Greenland ice sheet loss is felt largely in the Pacific, Antarctic ice melt will be felt in Europe. It matters where the water comes from. A point not generally appreciated.
So this new paper is also important, but it only underlines that we need to be able to make much much better estimates of how fast and how far the ice sheets will retreat, which is the justification for much of my own scientific research.
Finally, I think it’s probably necessary to point out that sea level is already rising. This was asked by a listener to Inside science, one of my favourite BBC radio 4 programmes/podcasts. I was a little surprised that an apparently scientifically literate and interested member of the public was not aware that we can measure sea level rise pretty well – in fact to an extent, the global warming signal is more easily detected in the ocean than in the global temperature record. This is because the ocean expands as it warms and there is ocean pretty much everywhere, whereas temperature observations are patchy and mostly on land. Clearly, scientists like myself are *still* not doing a very good job of communicating our science more widely. So here is the global mean sea level record to date, it’s updated pretty regularly here and on average, sea level is rising at about 3mm per year or 3cm per decade.
Sea level variation measured by satellite since 1993 from NASA
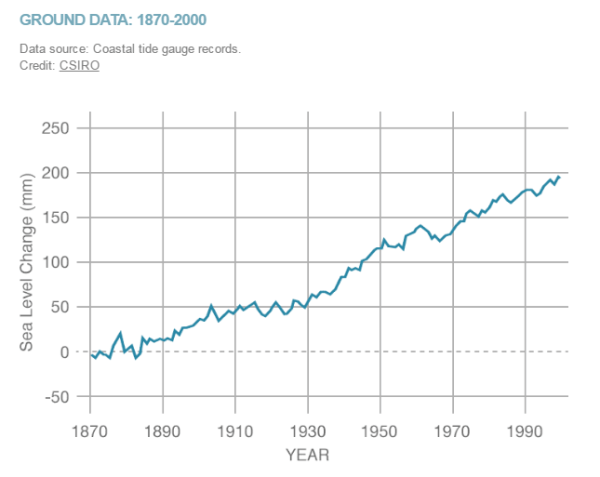
When we look at tidal gauges,sea level rose about 20cm in the 2oth century
Sea level rise in the 20th century measured by tide gauges, plot by NASA, data from CSIRO
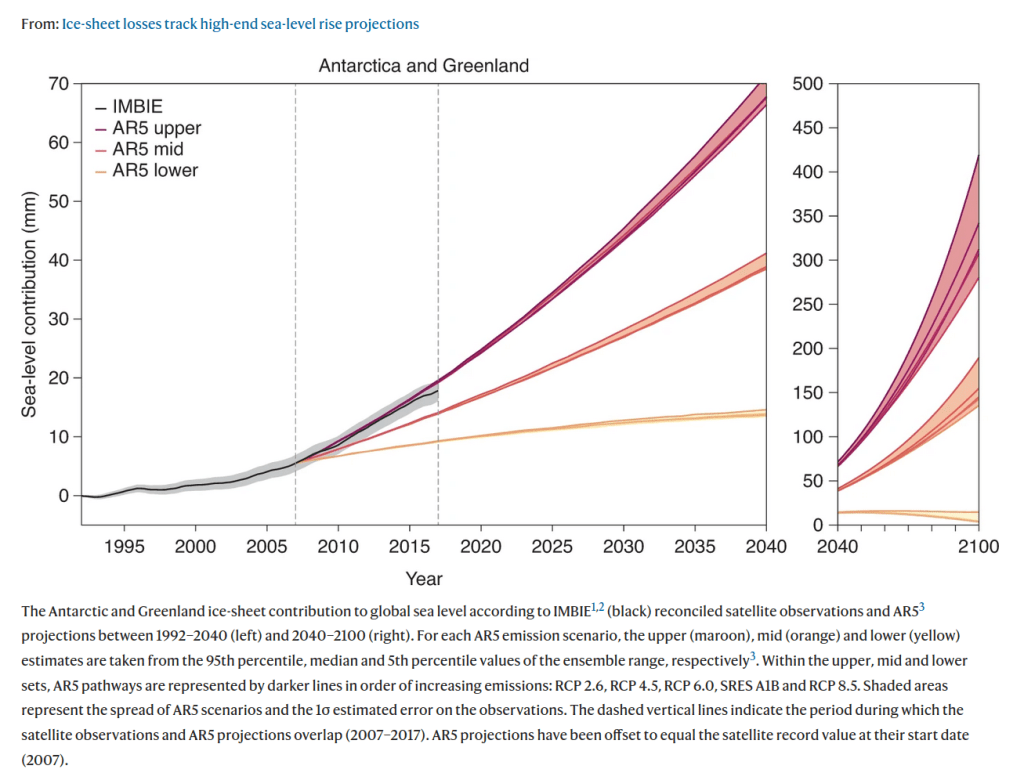
The big uncertainties we have on whether or not this will accelerate in years to come is largely down to missing processes in ice sheet models that we don’t yet understand or model well – mostly calving by glaciers and ice shelves. I promised Steve Bloom a blog post on that at some point – I have a paper to finish and new simulations to run, but hopefully I’ll get round to that next.
UPDATE: I was made aware this morning of a new report from the European Environment Agency about climate change impacts and adaptation in Europe. In the report they state (correctly) that while the IPCC 5th Assessment Report suggested that in the 21st century the likely sea level rise will be on the order of half a metre, some national and expert assessments (I took part in a couple of these) had suggested an upper bound of 1.5 – 2m this century, for high emissions scenarios.
This is a big difference and would be pretty challenging to adapt to in low-lying countries like the Netherlands and Denmark, not to mention big coastal cities like London or Hamburg. It’s laso important to emphasise that it doesn’t jsut stop at the end of the century, in fact our simulations of the retreat of Greenland ice sheet suggest it’s only just getting going at the end of this century and the next century the rate of ice loss will really start to accelerate.
All of which is to say, there’s really a very good reason to act now to reduce our emissions. The EEA has also produced this very nice map of observed sea level rise in Europe over the last two decades based on Copernicus environmental data.
With the prospect of American federal funding for environmental observations being reduced or strongly constrained in the future, it’s really important we start to identify and support the European datasets which are the only other sources of environmental monitoring out there right now.
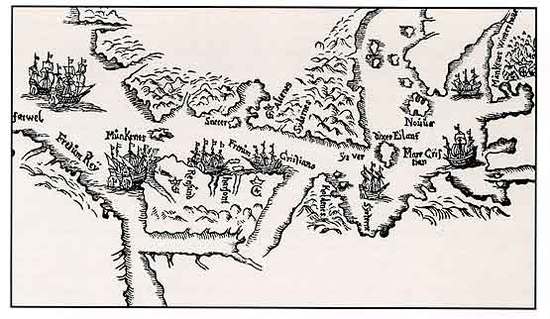
On the 16th may 1619 two ships, the Unicorn and the Lamprey, set sail from Copenhagen searching for the fabled North West Passage. On board there were 65 men, led by their captain, the Danish explorer Jens Munk. A year and a half later, the Lamprey limped back into Bergen (Norway) with just 3 men, including Munk, on board.
Almost all of the other crew members had died of scurvy in Hudson Bay .
The story of this terrible voyage, their sailing round Iceland, Greenland, Baffin Bay and into Hudson Bay is outlined in this wonderful atmospheric podcast from DR.
A Map, hand-drawn by Jens Munk in 1624 of the area between Cape Farewell and Hudson Bay, seen from the north; (Source: Tromsø University library)
The UK has similarly many tales of Arctic and Antarctic suffering, listening to the podcast I was put in mind of Coleridge’s famous “Rime of the Ancient Mariner”, but we rarely hear of the similar stories from other nations, a clear benefit of learning other languages is being able to access these archives and stories*.
The podcast contains a wonderful description by a Greenland pilot of the sea ice and how tricky navigating it can be along with interviews and inputs from many others. If you are at all familiar with Danish – I really recommend the series.
However, the description by a nutritionist of the terrible effects of scurvy had me wondering. I learn (via Dutch family and confirmed by the OED) that the name of the disease, caused of course by a lack of vitamin C in the diet, is probably from the Dutch Scheurbuik – rip belly – an eloquent description of one of the notable later stages of the disease.
Rip here is less a description of enhanced musculature and much more a description of what it feels like when your internal organs start to bleed and your muscles and bones are weak from lack of nutrition.
Photo of chest cage with pectus excavatum and scorbutic rosaries – from this paper
Upon looking it up (Thankyou Wikipedia), I learn that the causes of scurvy had been repeatedly identified, forgotten and mistaken since at least the middle Ages. There is an estimate that around 2 million sailors died as a result of scurvy between 1500 and 1800.
2 Million almost entirely preventable deaths and 2 million men who died in appalling agony.
And this happened in spite of what appears to be the first recorded medical trial by James Lind in the 1750s, it still took the Royal Navy 40 years to start giving out fresh citrus fruits as a standard on their ships. Vitamin C itself was only finally recognised and extracted in 1932.
This story is an outrage in many ways, but a clear example also of how science and medicine, properly conducted, can help to improve and save lives. It is also a clear warning to conduct thoughtful experiments with care and to listen to those warnings when they have been issued.
It might also be a recommendation that learning foreign languages is not only fun and useful but can be it’s own reward.
*I should also mention here that the rather awesome Danish Arctic Institute are currently producing a very well written series on Danish exploration in the Arctic in English, based on their own very comprehensive podcast series. These are published online in the Arctic Journal. Both the series of historical accounts and the newspaper in general are absolute top recommends for those interested in the subject of the Arctic environmentally , socially and politically.
The lure of the poles (Svalbard in Spring, the coldest time of year)
Extract from “Rime of the Ancient Mariner” by Samuel Taylor Coleridge
I have tried to list all the different people and websites that provided material for this presentation, but if I have forgotten anyone, please do let me know and I will be more than happy to add an acknowledgement.
Normally I work on the continental or hemispheric scale, concentrating on Greenland and the Arctic. Next week, I have a new challenge, to go much more local than that, to the country and even county scale.
These inspiring women have showed themselves to be a formidable lobbying force over the years and subjects as diverse as bees and pesticides to care for people with dementia and the plastic bag tax. Years ago, I recall my mother coming home from a WI meeting and talking about the ozone hole, one of the earliest organisations to start talking about it, so it is not a particular surprise they now have a focus on climate change. They now have a climate change ambassadors programme.
Some of the many successful WI campaigners over the years from
Each area has to organise themselves and decide what they would like to do as part of this, so as partly a kick off to that process and as part of their science committee activities (It’s not all Jam and Jerusalem at the WI these days apparently) I will be presenting in Stafford at the county council chambers on the 6th July 1.30-3.30pm.
The Staffordshire County Council chambers
As part of the programme, Staffordshire County Council will also be sending a representative to talk about how the County is responding both in terms of managing impacts and reducing emissions towards achieving the UK’s targets.
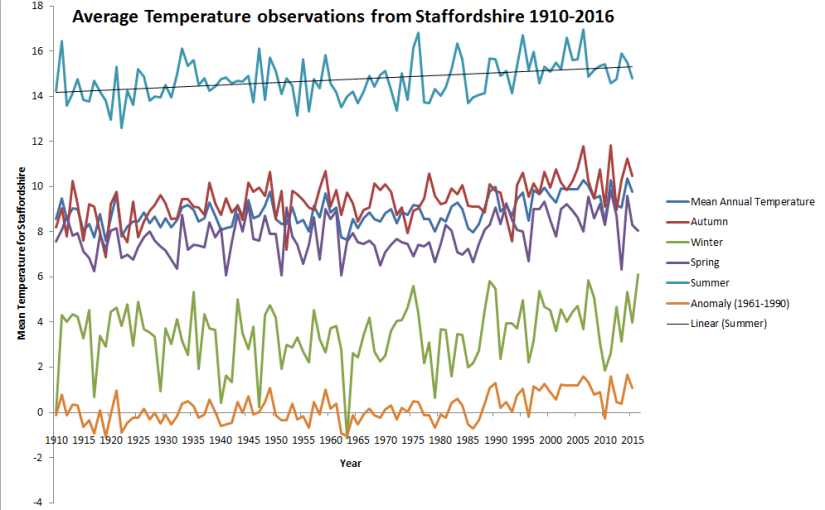
It’s going to be interesting talking about climate change both observed and projected in the UK, happily, the UK Met Office is a world leader in this and the very friendly Mark McCarthy has provided me with a bunch of data to distil down and prepare some visualisations from (see graph below for a quick and dirty look at some data)
I also plan to talk about the basic science of climate change, how it has developed, how it is observed and how we make projections and what we expect for the UK and Europe over the next decades to centuries. I have called it questions and answers since I hope that people will ask questions as we go through. From talking to people everyday, it’s clear there are a lot of questions people have about climate change and the impacts and the sciense. I also hope to talk about some of the options we have for tackling emissions and how to deal with the impacts. Copenhagen is a great case study for both of these elements. This is quite a lot for a short hour or so talk, but let’s see how we get on!
A quick and dirty plot of avergae observed temperatures in Staffordshire (annual and seasonal means 1910 – 2015/2016) with thanks to UK Met Office and Mark McCarthy for providing the data.
It’s open to the public so if you happen to be at a loose end on a Wednesday afternoon and fancy it, I believe you can get tickets via the following secretary@sfwi.org or telephone 01785 223838.
In the mean time, should any members of the WI or indeed other Staffordshire residents who happen to be reading this, have any questions or ideas that they would like addressed specifically, please do feel free to leave a comment or ask me on twitter.