Q is for Qaanaaq

Back in Denmark after 2 weeks in Greenland. Always a bit strange to come back, not just that transition from Arctic cold to European Spring but the sheer abundance of the fertile mid-latitudes, colours, plants, trees, the sheer number of people.

Not to mention that expedition frame of mind, where you are really focused on accomplishing a given set of often quite complex tasks (almost) without distraction. It is the ultimate deep work task, and naturally readjusting to family life, not to mention the tsunami of work tasks left on hold is… difficult.

This particular deep fieldwork has been carried out in Qaanaaq, Northern Greenland, as I’ve written about before. The community of about 600 people (and maybe a 1000 dogs), was established in the 1950s when the US established the Thule air base. It is almost the most northern settlement in Greenland – and certainly the largest. The small village of Siorapaluk is about 45km (or 6 hours by dog sled) further away.

The town was formerly a summer hunting spot, but after Thule was decided on, the community was moved to Qaanaaq year round. It has an association with the famous Danish explorer Knud Rasmussen, whose old house is a museum (allegedly. I’ve never actually had time to visit it..)

DMI established a geomagnetic observatory there in the 1950s and today its part of the Comprehensive Test Ban Treaty Organisation network that DMI operates on behalf of the Danish government from what we now call the DMI geophysical facility. There is transnational access to this via the INTERACT network.

This year we again visited the glaciers at the head of the Inglefield Fjord – expanding a new research programme we piloted last year. We also did a lot of work on the sea ice – not just Steffen Olsen‘s ocean programme, but a new NCKF research programme looking at biological productivity and carbon cycling in the fjord, led by Anna Pedersen, a DMI PhD student also at the University of Southern Denmark. I and another colleagues also did a lot of work on snow processes that is something of a pilot programme for a processes project we’d like to establish next year that will also involve (hopefully) our weather forecasting colleagues and perhaps also the GEUS PROMICE programme.

All of this work involved 6 days of travelling over and camping on the sea ice, plus an additional day trip. We were lucky with the weather, although it was *extremely* cold, around -25 to -28C most days, and dipping well below -30C at night (though being after the equinox it was never truly pitch dark). However, in general there was little wind, no fresh snow (which can really slow the dogs down as they struggle to pull through deep soft snow) and the sun shone every day. This meant we basically managed to achieve the full planned programme – including our extra-optimistic goals – which almost never happens in fieldwork.

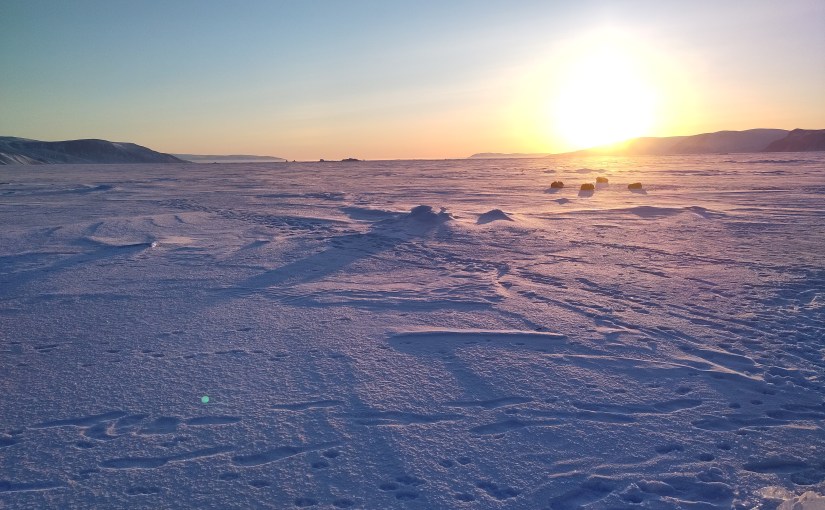
Camping on the sea ice at sunset. Northern Greenland
This work by Ruth Mottram is licensed under a Creative Commons Attribution-NonCommercial-ShareAlike 4.0 International License.

I intend to write a whole series of posts based on what we have been doing scientifically and technically as well as some general observations. There have been various hints already in my preferred social network. The whole trip was super inspiring, it’s always valuable to get out and observe the real world when you’re trying to model it, understand it and make projections of sea level rise.

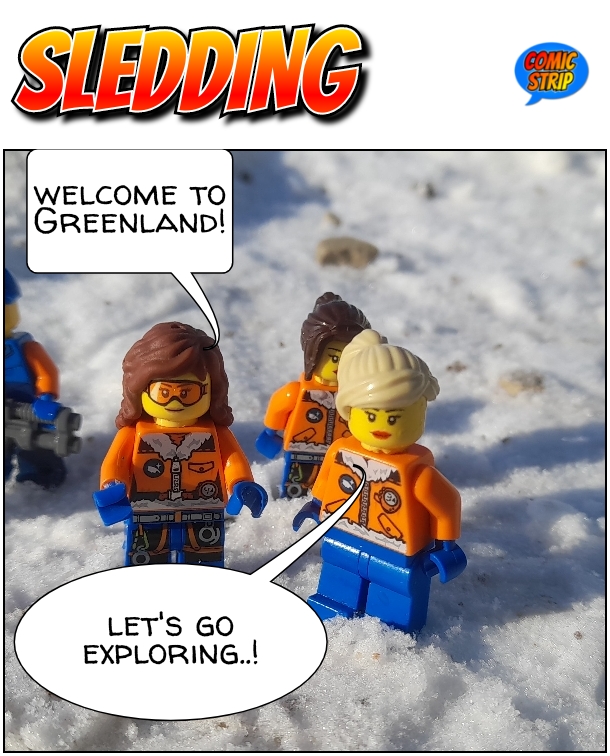
I also promised to make another Lego scientists series and took quite a few photos in between times to do so. However, the research programme was packed, so I had no time at all to make the comic during fieldwork, that will have to wait a few weeks.

Expect my pixelfed account to host gratuitous numbers of dog pictures. And ice pictures. And unexpectedly clear blue skies. For now it’s time to unpack, get the washing machine going and spend some time with my family.
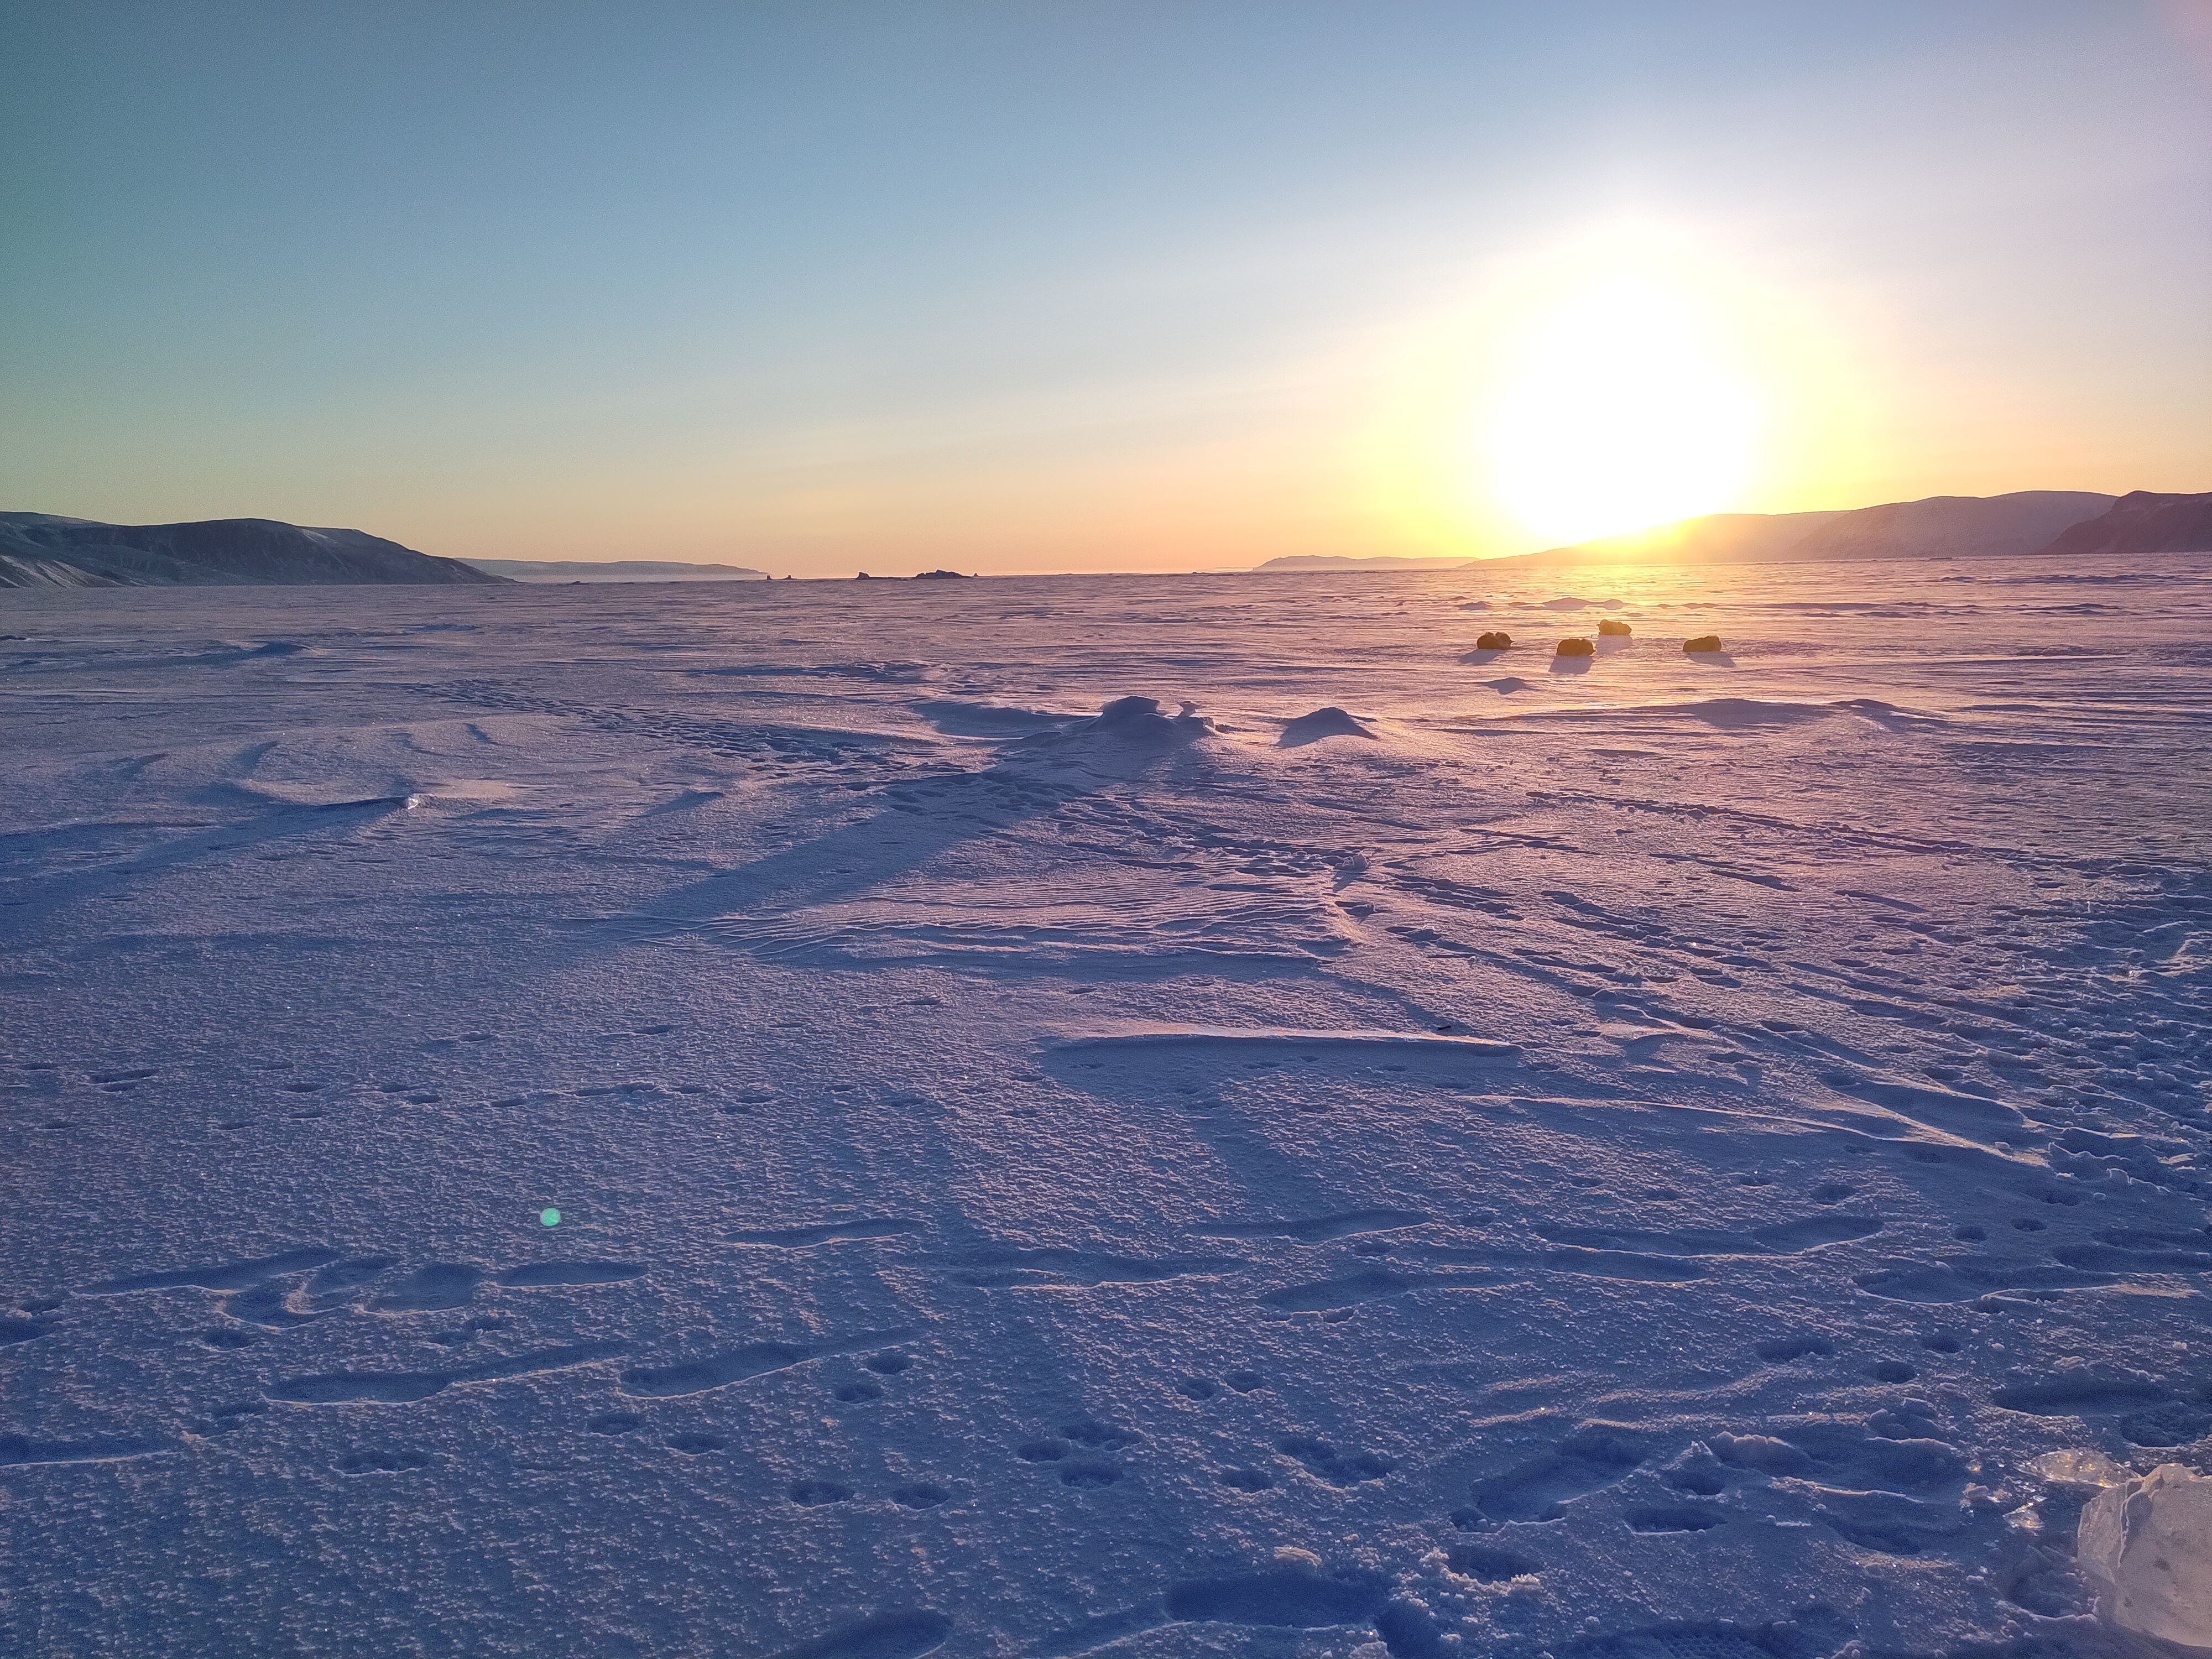
Sunset over sea ice near Qaanaaq, North West Greenland
This work by Ruth Mottram is licensed under a Creative Commons Attribution-NonCommercial-ShareAlike 4.0 International License.

As ever, thanks to my amazing colleagues Steffen Malskær Olsen, Andrea Gierisch and Anna Pedersen for an incredible trip and to DMI station manager in Qaanaaq Aksel Ascanius without whom most of this work would be impossible.

Special thanks to our friends in Qaanaaq, the local hunters, whose unfailing energies and knowledge are absolutely essential to these scientific projects. We literally could not do this without them and of course their dogs.

I must also credit DMI and the Danish Government for funding via the National Center for Klima Forskning and thanks also to Horizon Europe projects PROTECT on sea level rise and PolarRES for additional inspiration and funding and to my colleagues at the Horizon Europe/NERC project OCEAN:ICE for indulging my two weeks away. All three projects will benefit from the insights gained in this fieldwork.
The further adventures of batgirl…

I wrote this series of comics to amuse and inform my kids while I was on fieldwork a few years ago. It turned out to be quite a success and my kids classes both read the Danish versions at their school.

Last year I started https://icemangoeshome.wordpress.com/more-arctic-adventures/ the further adventures of batgirl on the ice with her new friends the Lego scientists and a couple of stowaways.. but last year’s season was extremely busy and I never managed to finish it.

I asked yesterday on mastodon if I should do another this year, and the only feedback I got was I should try to finish the one I started last year. So maybe that’s what I’ll try to do. It’s always challenging fitting around field tasks though so no promises.

This is just a quick post from the airport: you’ve been warned, bat girls and her friends are on their way back with a new season!

A New Arctic Adventure

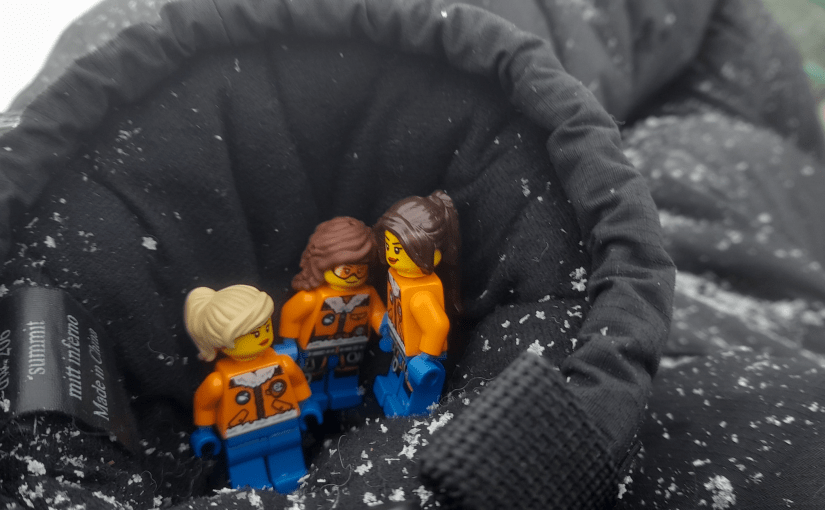
Lego figures in the snow

Natural cycles: oceans and glaciers and volcanoes…

Reblogging this brilliant piece in Ars Technica* with thanks to Andrew Dessler on Mastodon for sharing.

It’s a really thorough introduction to the climate system and all the natural sources of climate variability and cycles of change, including links to sources. Well worth taking your time over with a morning cup of tea and probably I’ll assign it as an introduction text for BSc students (and management) on the big picture of climate change.

I also love it for the introduction where multiple eminent and respected scientists are asked what they’d buy with all the dollars they’d have if they were given one dollar every time someone asked them about “natural climate cycles”. As you might expect, the answers range from heat pumps and solar panels to new bicycles and a time machine.

Not sure what I’d use it to pay for, possibly a new postdoc position to work on snow and ice processes?

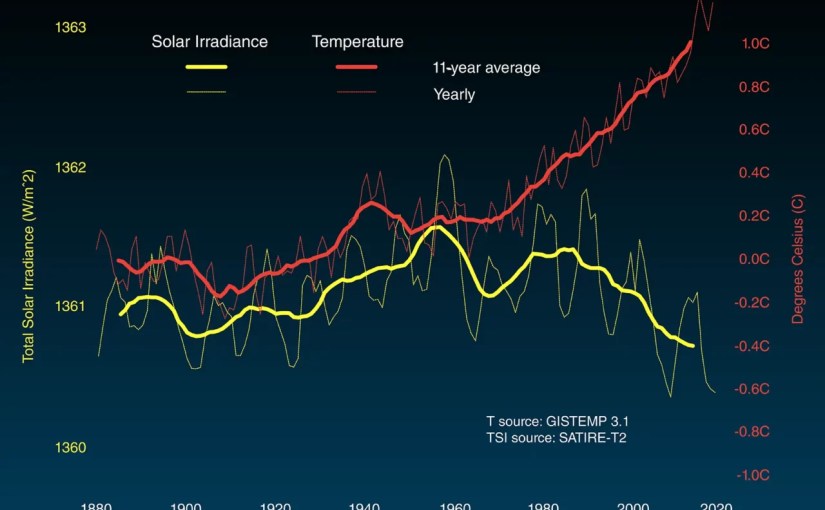
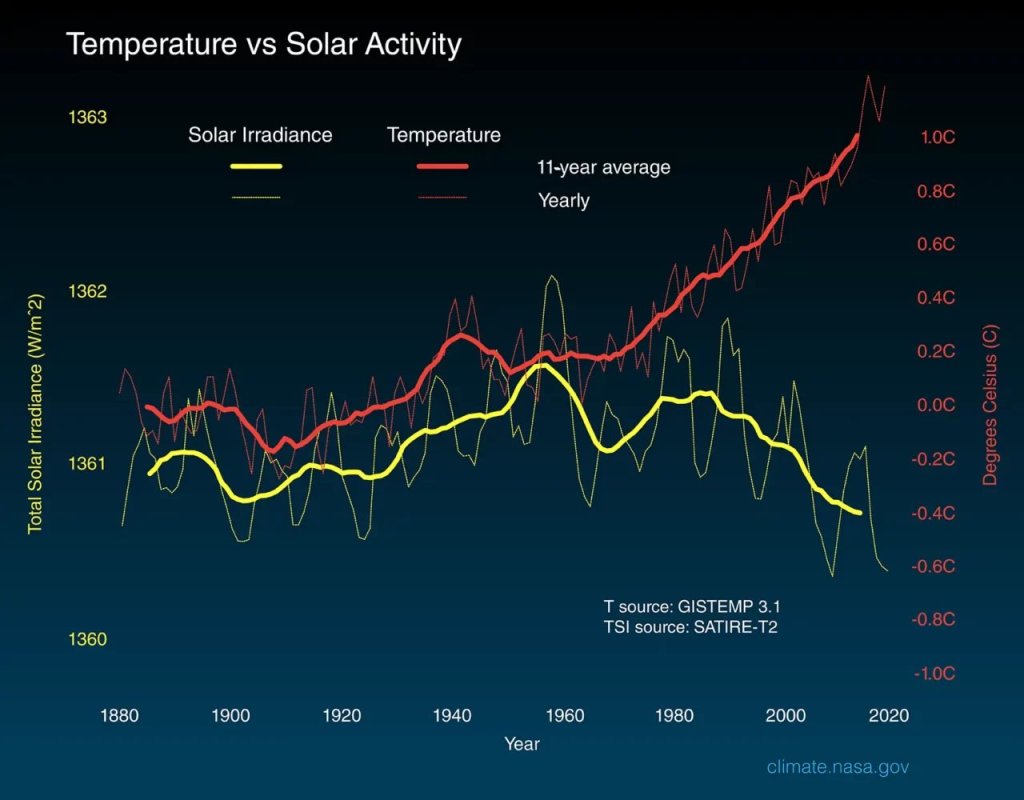
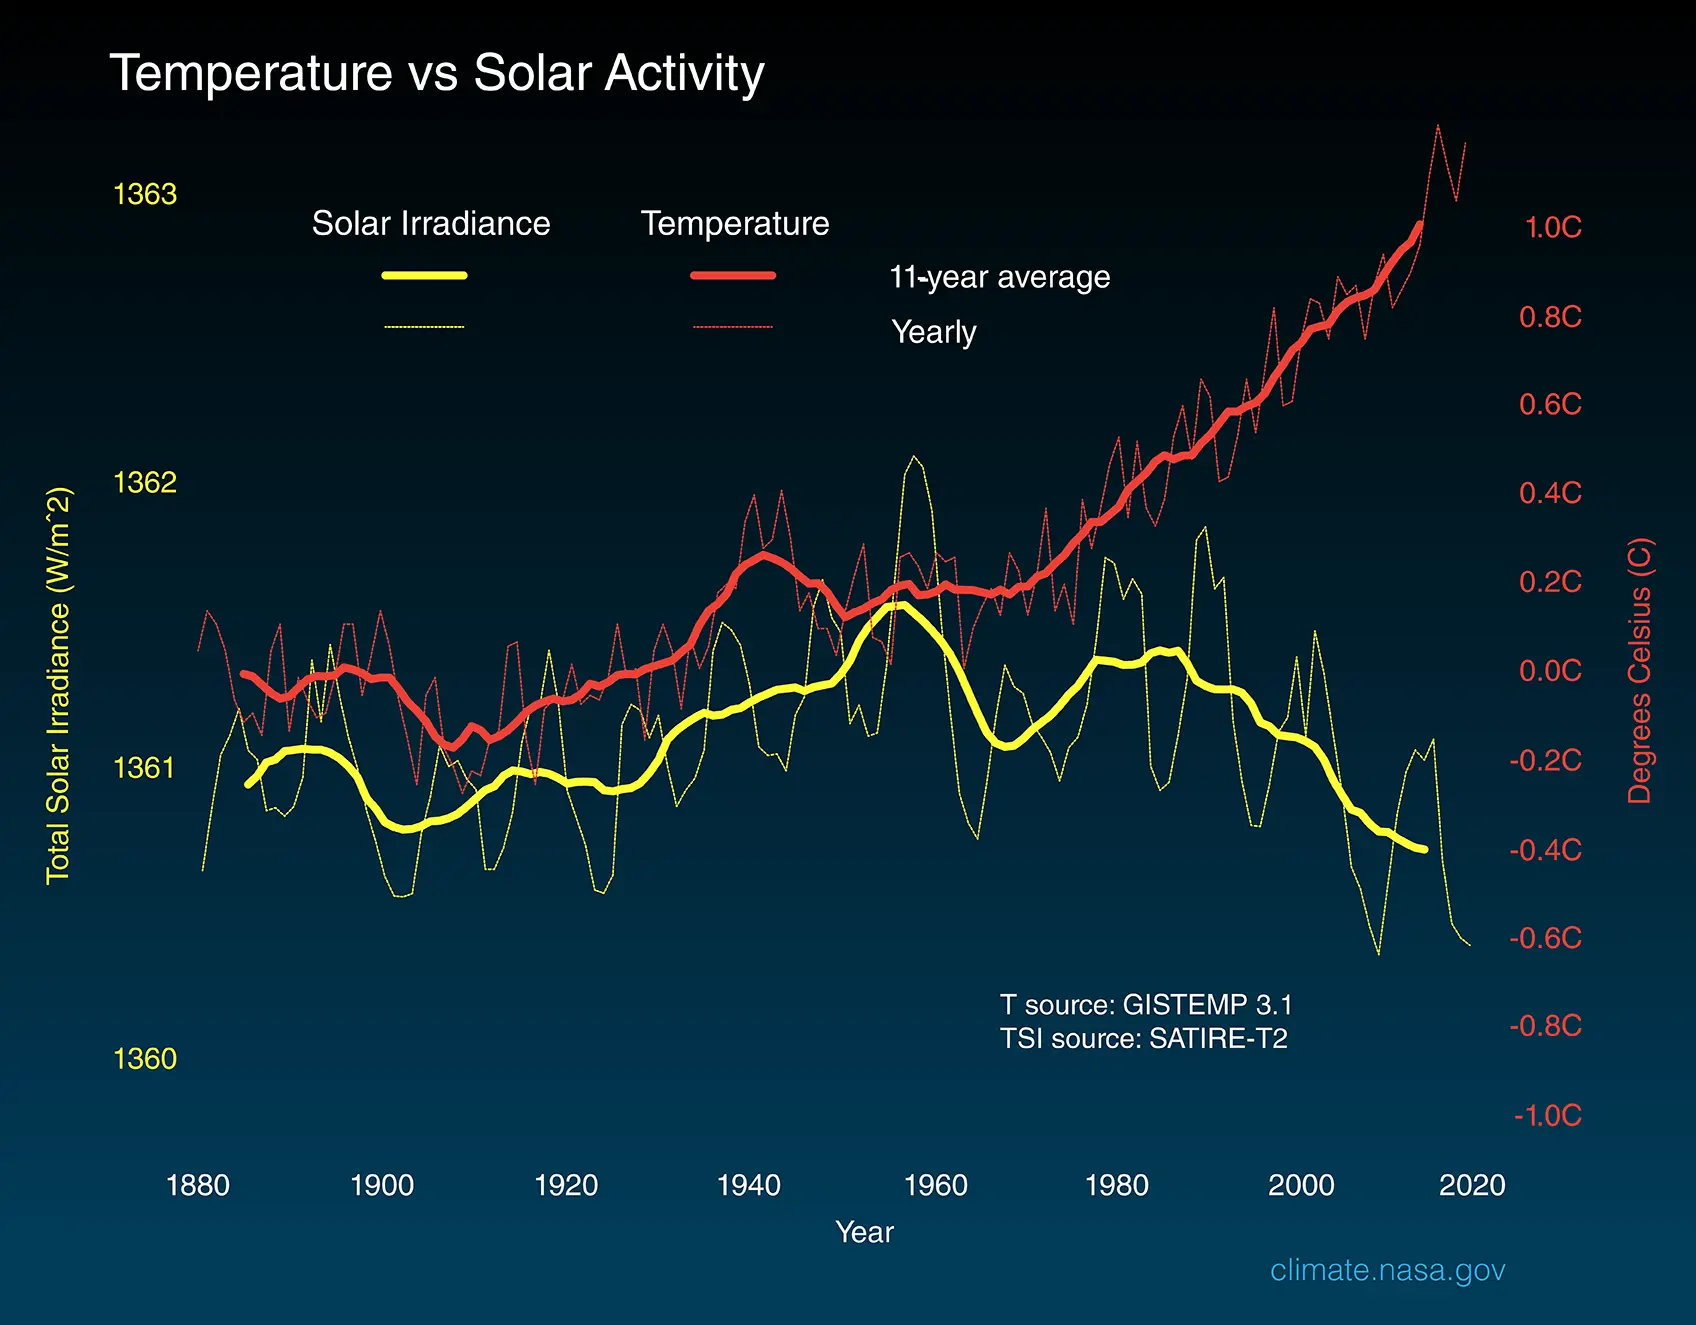
Figure from NASA showing changes in incoming solar and the global temperature

Now that the doubt is out the way, please go and also read this wonderful piece by Rebecca Solnit in the Washington Post about why and how reducing fossil fuel use might lead to abundance and joy and enhanced quality of life (hat tip to David Ho also on mastodon for this one).

*as an aside: I haven’t read Ars Technica in ages. And it’s funny because I remember that when I first started on twitter way back in 2010 there were *a lot* of good articles shared from there on the bird site. Somehow they either were not shared or got suppressed and I stopped seeing them. I’m not sure if that was due to the algorithm or different people I was following. One of the nice things about mastodon is that without an algorithm (and crucially, by following *a lot* of people!) there is a chance to see a much greater diversity of different media. It feels a bit like seeing a different internet, outside the standard walled garden.

Out and about in Leeds..

I’ve been on holiday this last week and I’m combining the trip to the UK with a visit to colleagues and collaborators at the University of Leeds. I’ve also been nabbed while I’m in Leeds to give a wider interest talk at the Royal Meteorological Society Yorkshire branch in Leeds.

I’ll be discussing ice sheets, their contribution to sea level rise and how the future is looking. There may also be some nice photos from our fieldwork in Northern Greenland for those who like dogs, icebergs and snow…

If you’re in Leeds and fancy joining you’re most welcome to register and attend at this link.

In general, I’m trying to reduce my travel this year, last year, with all the rolled over meetings from the COVID times was disruptively busy with work travel, it makes it challenging to actually get the work done. So I think combining work and holidays and rolling up meetings into a block is the way forward.

Although I very much appreciate the opportunity to present online at various meetings, I’m less convinced about hybrid meetings where the purpose is mostly scientific discussions, that is something that works much better either all online or all in person in my opinion, but I think they work well when the aim is to present new and ongoing work (like EGU).

For those who are interested but can’t attend I will see if the talk tomorrow will be recorded and can be uploaded somewhere. Here’s the abstract:

Frozen Threats: Understanding the Role of Ice Sheets in Sea Level Rise

In this talk, we will delve into the world’s ice sheets and explore their importance in the climate system. Ice sheets are the largest stores of freshwater on the planet, their size and location means they influence our climate but their interactions with the atmosphere and ocean are complex. As the world warms, they will inevitable have an impact on sea level. Adapting to sea level rise will be one of our civilisations biggest and longest challenges, so understanding ice sheets is now of critical importance. They are also beautiful and fascinating environments in their own right. In this talk I will discuss some of the scientific challenges, but also show how far we have come in understanding ice sheets and glaciers.

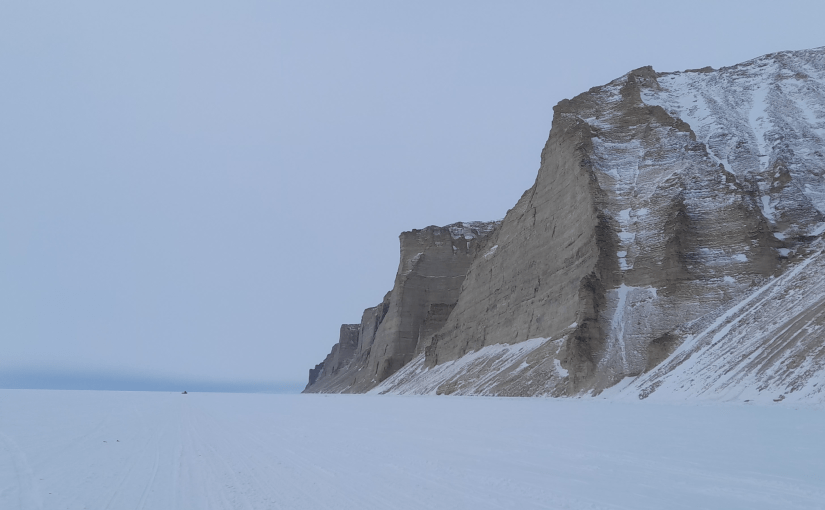
The Inughuit cliffs near Qaanaaq in Northern Greenland rising up above the sea ice. In the far distance a dog-sled is a small black speck.

Politics, history, science and the continuation by other means

War is not merely a political act, but also a real political instrument, a continuation of political commerce, a carrying out of the same by other means. All beyond this which is strictly peculiar to War relates merely to the peculiar nature of the means which it uses. 

Carl von Clausewitz, On War

I have lots of thoughts about this really great Timothy Snyder piece on the US 2016 elections, (not least, I wonder what it means for how we understand Brexit too?)

But most of all I’m reminded of Gary Kasparov’s declaration that the point of modern propaganda is not to make you believe something but it’s to make you believe nothing. (I paraphrase slightly). Much of the piece is about how the Russian propaganda operation as been so successful at engendering doubt about Ukraine and the state of relations between Russia and Ukraine.

I sometimes feel the invasion of Ukraine has really been a wake-up call for many of us because it’s just so undeniable. An actual event happening to real people that we know with a pretty clear narrative. The genius of Russian influence operations has always been to muddy the waters sufficiently that it was a little hard to trust anything that anyone said or wrote.

In this sense I’ve also found Timothy Snyder’s series on the making of modern Ukraine (which I’ve been listening to over the last few weeks) brilliant and helpful and interesting. The subject is fascinating, but it also because it becomes clear listening to a historian that, yes there can be different ways to interpret events, but the events themselves are real and we have a duty to try to learn the facts before judging them.

This is of course exactly how scientists should think, that we have to establish good observational data before trying to interpret it. We also need, inevitably to consider what are the uncertainties and likely range within that data. What is missing? What can’t we know? What is the most likely interpretation based on the things we can observe? How reliable are our measurements?

One of my favourite teachers at school who really helped to develop the way I think was very clear on how to do this. And he was not a scientist, he was a historian.

Ultimately, I was more interested in understanding the physical world and went on to study glaciers, ice sheets and the climate system at the poles. However, as I’ve been focusing more on sea level rise and how on earth we adapt to a changing climate it’s quite clear that going back to the social sciences will be important to understand human behaviour. And the murky way other actors seek to influence us as we adapt to climate change is also going to be important to understand. There has been undue influence from a “Merchants of Doubt” perspective for sure for many years when it comes to the causes of climate change and the effects. This is very clear in the mess of climate denial that the new Lord of Twitter has unleashed, it’s a little bit like returning to 2009.

But here we are in 2023 and there are apparently serious politicians having hissy fits over the idea that a significant source of indoor air pollution should maybe be replaced with a far more efficient alternative (yes I’m talking about replacing gas stoves with electric induction), imagine how climate adaptation can be weaponised just as for example COVID vaccination was as part of the culture wars?


Anyway, this is a bit incoherent maybe. But it’s a great piece for clarifying what we know now and maybe for working out what comes next in terms of Russian interference in democratic institutions. And from a climate scientist perspective it’s also another reason to try to avoid (if we can), becoming just another cultural battleground. This is also key: it’s not always about money, sometimes people really are being manipulated for other reasons:

“When people act in the interest of a foreign power, it is sometimes for money, it is sometimes because the foreign power knows something about them, it is sometimes for ideals, and it is sometimes for no conscious motive at all — what one thinks of as one’s own motives have been curated, manipulated, and directed.  It seems quite possible — I raise it as a hypothesis that reasonable people would consider — that some mixture of these factors was at work at FBI New York in 2016.”

Well worth reading the whole thing.
https://snyder.substack.com/p/the-specter-of-2016

Rules of thumb about ice sheets and sea level rise:

One of the advantages of being part of a research institute are the fascinating conversations that happen over lunch between colleagues working in different areas. Today was a classic with conversation ranging from the stratospheric effects of the Hunga-Tonga eruption to the different types of snow crystals that form in snow packs and their impacts on sea ice. However, the conversation started with a request to me for some rules of thumb on sea level rise, so here they are: 

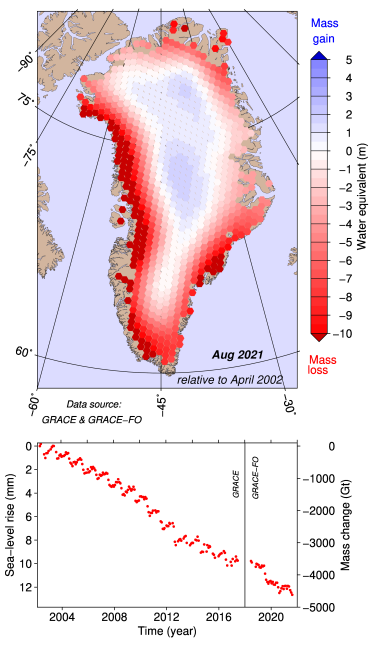
The Greenland ice sheet loses on average around 250 to 280 Gigatonnes of ice each year – that’s from all processes including melt and surface runoff, iceberg calving, basal melting and submarine melting.

It varies a bit from year to year but over the last 26 years the ice sheet has either lost ice or been neutral (and it’s had very few neutral mass budget years).

Change in mass of the Greenland ice sheet from the GRACE and GRACE-FO satellites since 2022

The Antarctic ice sheet loses on average about 100 Gigatonnes of ice net each year (probably) from all processes, it receives about 2000 to 2500 Gigatonnes of snow (depending a bit on where you measure Antarctica to end) whereas Greenland receives around ~700 gigatonnes of snow.

The small glaciers and ice caps around the world contribute a bit more to sea level rise in total each year than each of the big ice sheets currently, but they will be quickly exhausted. As there are thousands of small glaciers, most of which are not well monitored, we have to estimate how these are changing using models. It appears that on avergae they add around 0.7 to 1 mm of global sea level rise each year.

Glacier changes are not well measured at most glaciers but this analysis from Copernicus is based on a few that are in Europe.

The thermal expansion of the oceans is still the largest part of currently observed sea level rise but on an annual basis, the cryosphere now often contributes more.

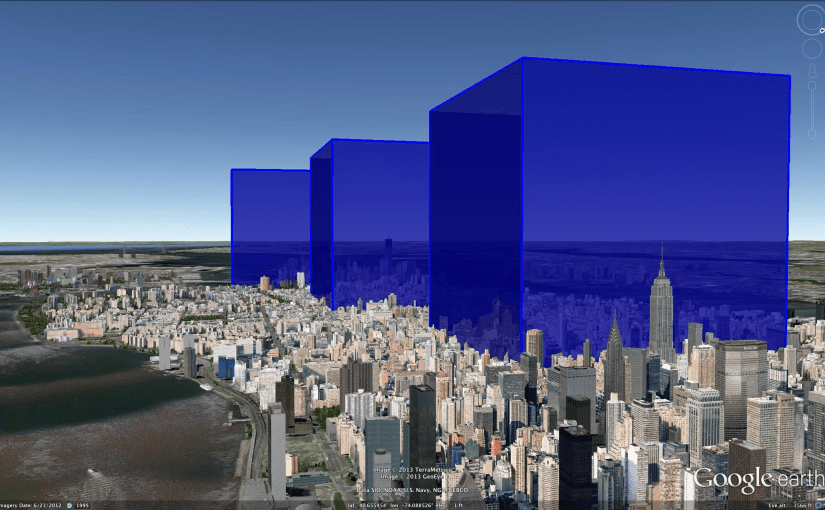
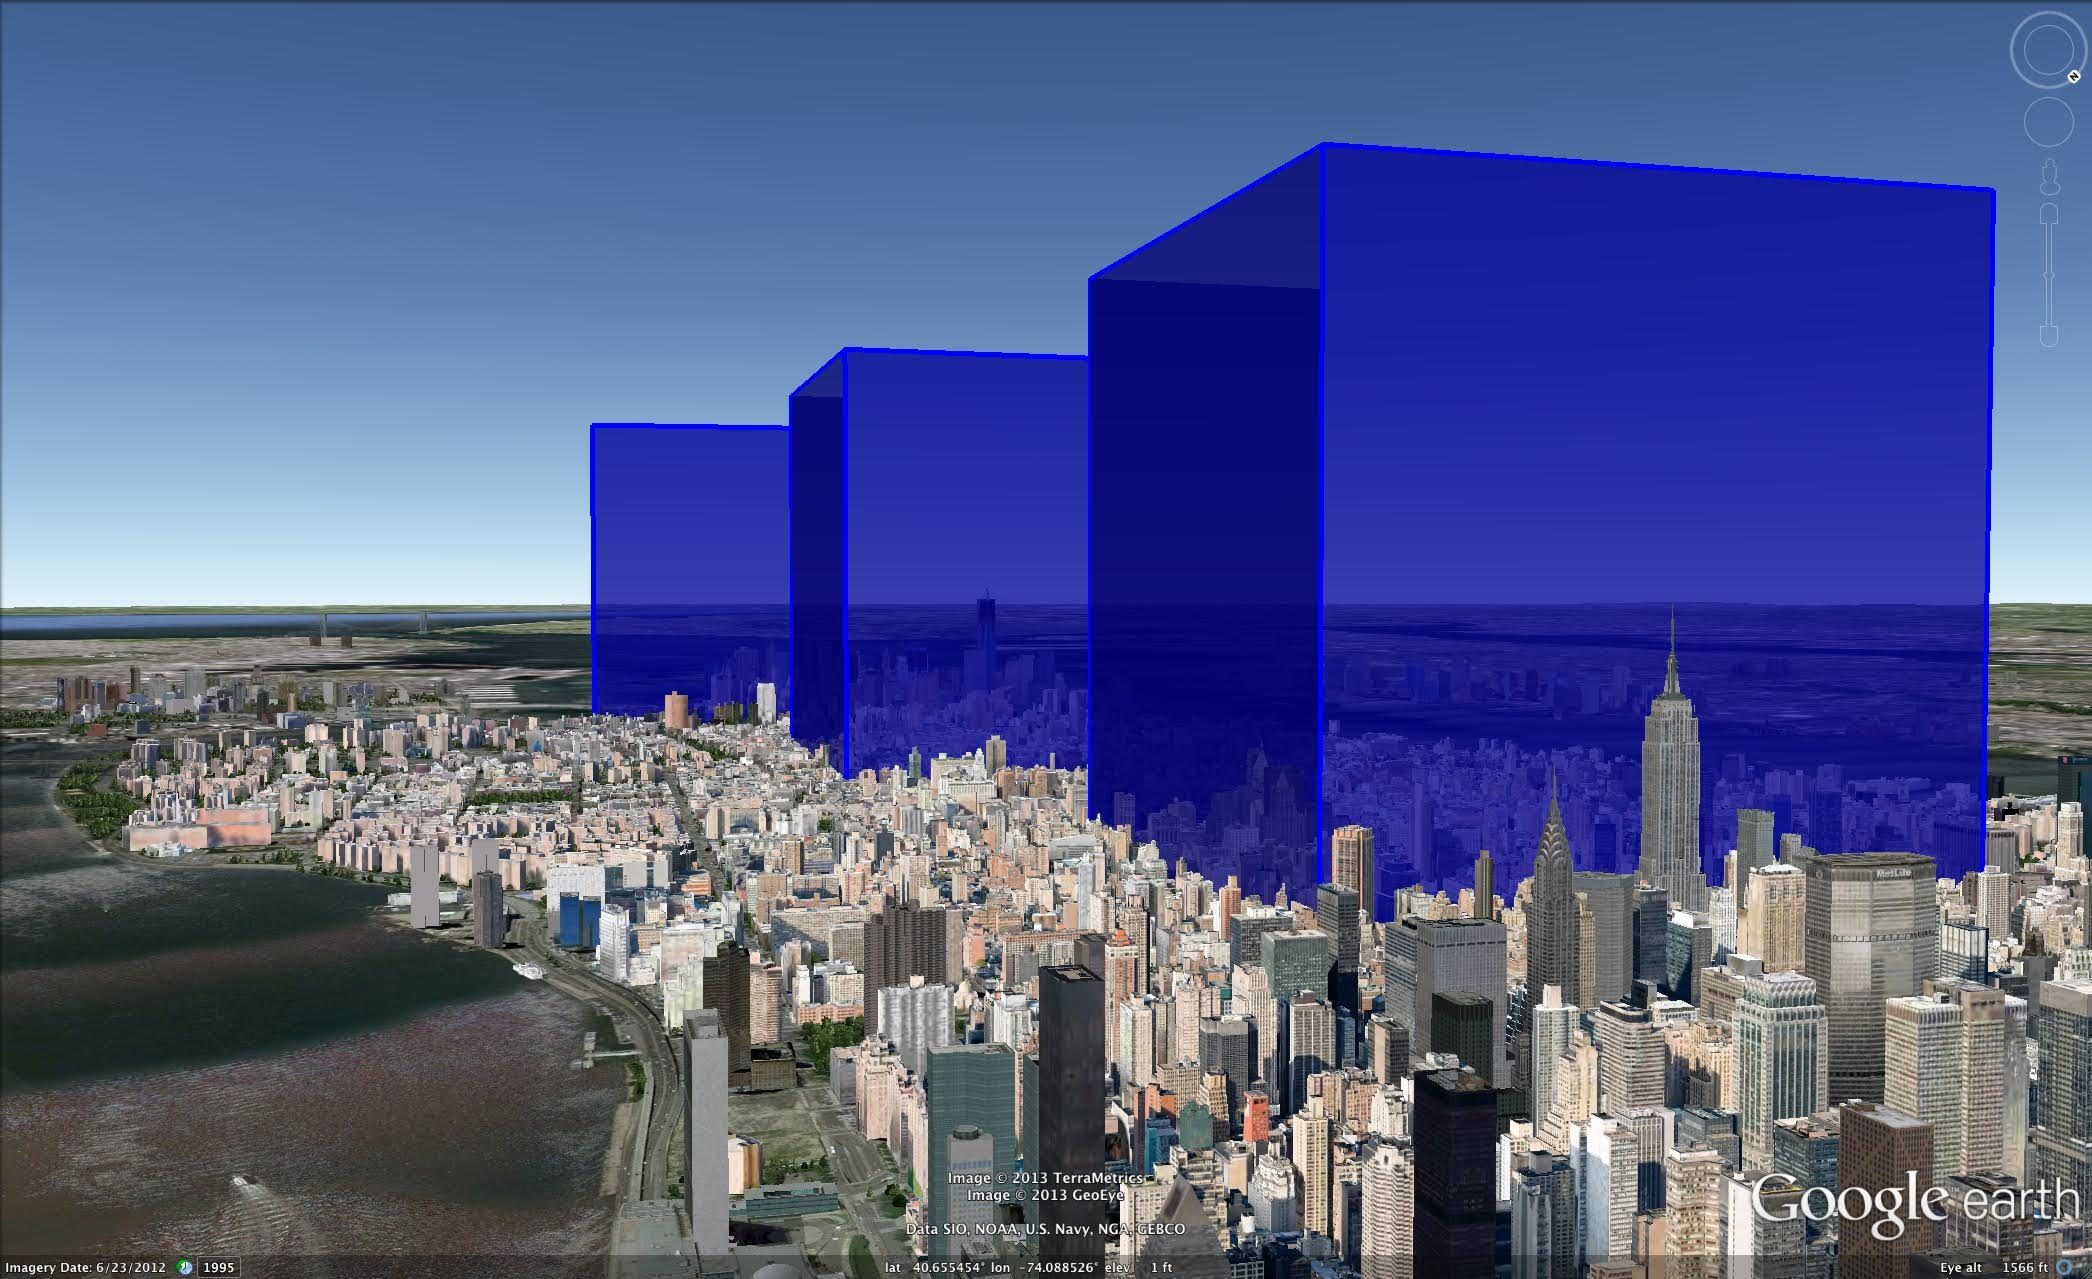
As I’ve elaborated on before, 1 Gigatonne of water is hard to visualise, it is a cube 1 km long, 1 km wide and 1 km high and about 360 Gigatonnes (or km3) raise global average sea level by 1 mm, so Greenland contributes around a half to three quarters of a millimetre to global sea level every year. My old friend Lindsey Nicholson at Innsbruck University has a cool blog (which you should check out here) and shows this visualisation if it helps..

What a gigatonne looks like, visualisation shared by Dr Alex Gardner, JPL from this talk on glaciers and sea level rise

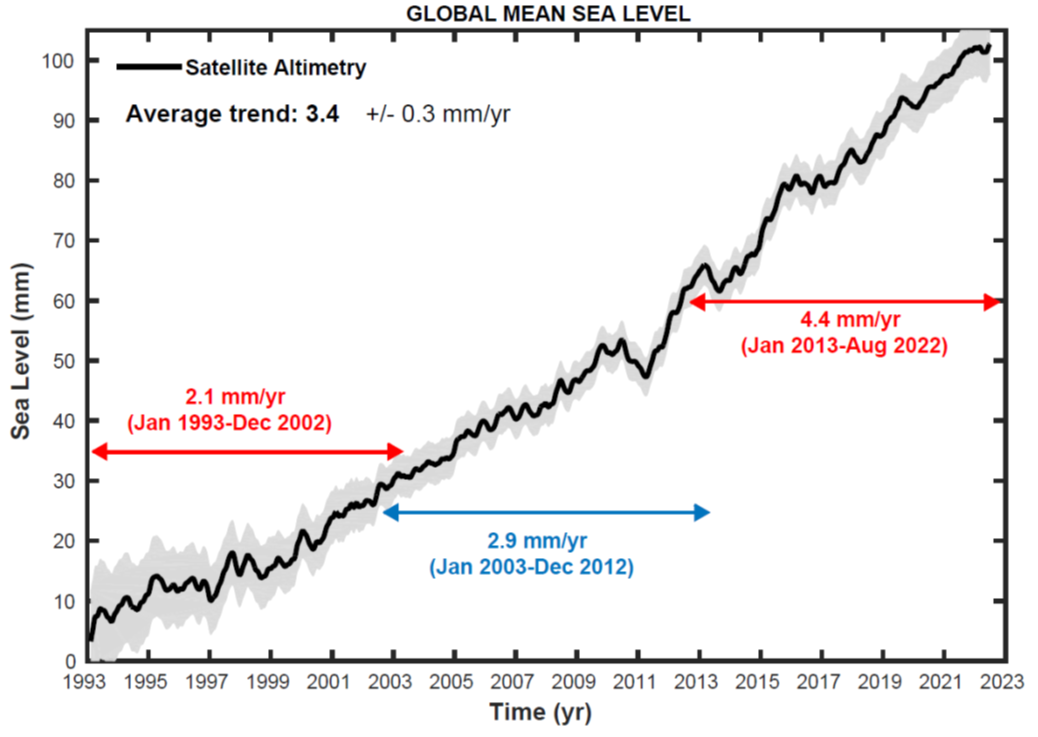
Since the early 1990s sea level rises about 3mm every year, but over the last 5 years it has been closer to 4.5mm per year. The curve over the last 2 decades has followed a quadratic shape rather than a linear shape – put simply, this means sea level is accelerating. The sea rose 10mm from January 2020 to August 2021.

Global mean sea level rise since the early 1990’s as shown in the WMO state of the climate report 2022

An El Nino, which some are warning could occur this year, may cause a temporary pause or at least slow down in sea level rise, even as global air temperatures increase, mostly due to the large amounts of rain that are associated with it, but this will only be temporary.

While the rate (3-4 mm per year) doesn’t sound like very much, every mm counts, increasing the risk of coastal flooding and storm surges affecting coastal communities.

Finally, global sea level rise is not distributed evenly, broadly speaking, the further away from an ice mass you are, the more likely it is to affect your local sea level, so Greenland matters less than Antarctica in Northern Europe.

NOAA’s visualisation of observed sea level rise from satellites in the background and at tide gauge locations (the round dots) since 1993, note the uneven pattern which reflects processes like ocean currents, atmospheric circulation and winds, local relative land movements and gravitational changes due to changing ice masses.

I hope these little rules of thumb help. Feel free to add more (or disagree) in the comments..

The vanishing of the ice…

I was recently asked to comment on this interesting new paper by David Rounce and co-authors for AP by Seth Borenstein called “Global glacier change in the 21st century: Every increase in temperature matters”. You can read his resulting summary here . I’m posting here the slightly expanded and lightly edited response I sent to Seth in response to his (very good) questions.

The authors only look at the small glaciers and ice caps in this study, not the big polar ice sheets, though they do also cover small peripheral glaciers in Greenland and Antarctica that are not part of the main ice sheets. Of course, this means that sea level rise from all the other important processes like thermal expansion and ice sheet met also have to be taken into account on top of the numbers given here.

Their main findings were that at 1.5 °C above preindustrial, we can expect total glacial mass loss between 2015 and 2100 would be 26% with 90 mm of sea level rise and 49% of the small glaciers and ice caps lost globally. The paper only deals with these small glaciers and does not count the big ice sheets!

At 4°C, we’re looking at 41% mass loss with ~154 mm of sea level rise and 83% of glaciers lost. At 2.7 °C, where the world is now heading, 32% mass loss, 115 mm of sea level rise and 68% of glaciers lost.

I’m sad to say that the results aren’t exactly a surprise – the community has known for some time that the loss of glaciers is basically linear with temperature, so the title of the paper is really spot on, every tenth of a degree really does matter. This earlier paper by my Horizon 2020 PROTECT project collaborator Ben Marzeion shows something very similar But it’s a nice new result with the latest generation of glacier model and updated with the latest CMIP (IPCC) scenarios and they included some new processes that weren’t very well accounted for in previous work.

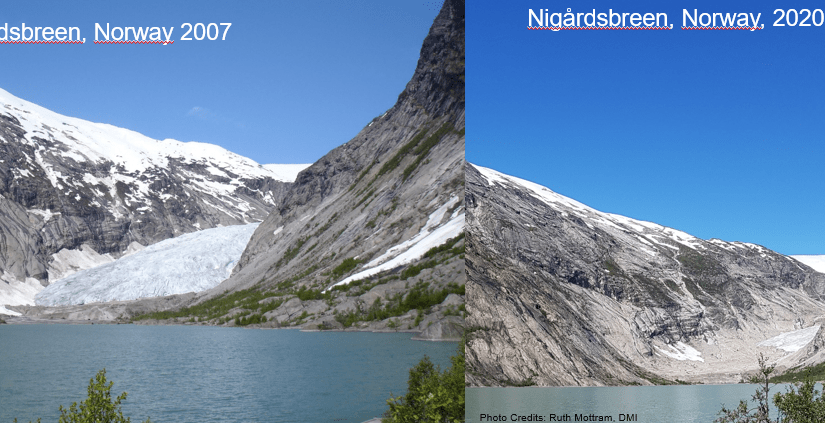
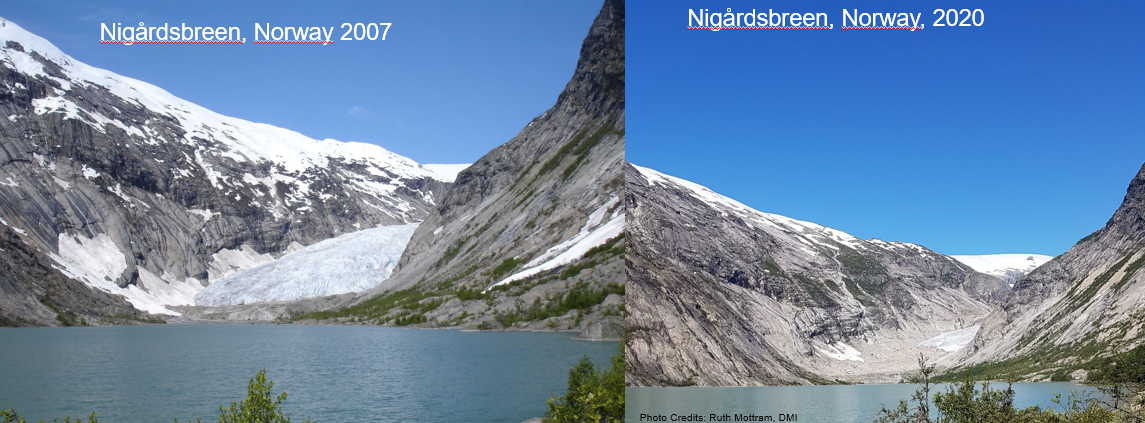
My first thought was that these latest estimates were actually a little lower than I expected, but the baseline in the paper is 2015 – we should remember that many of these glaciers have already lost quite a lot of ice (see my two photos of Nigårdsbreen in Norway, taken only 13 years apart) – so the new estimates are basically in line with what I would have expected given earlier work. I’d also expect that they will continue to lose ice beyond 2100 so it’s definitely not an end state that they are giving here. As they state in the article there will be widespread deglaciation of some pretty iconic parts of the world, even under the present planned emissions reductions..

In many ways part of the problem has been the previous studies have not always accounted for all the processes: frontal ablation (melt and calving of vertical ice cliffs, mostly in contact with water), the effect of debris cover and so forth (the latter will likely reduce the rate of loss, the former probably increases it). Given what we know about these processes and how to represent them in models, I still consider this work to be a more realistic estimate. Then we also need to account for the climate models and the scenarios used to force them – there are some important differences between CMIP5 and CMIP6 which might also account for some of this shift.  We have actually seen something somewhat similar for the projected changes in the big ice sheets.

It’s probably important to remember though that this study still needs to make simplifications, especially when looking at so many glaciers in so many different regions, so there will always be new updates to come with improved computing power and computational techniques and better representation of processes. Having said that, I do not think the picture will substantially change in future, though I can always be proved wrong, and the glaciers community are now at the stage of refining estimates for rates of mass loss.

Globally the loss of glaciers means sea level rise. Regionally and locally the biggest consequences will be for for water resources and we’re likely to see a local increase in natural hazards like outburst floods and avalanches that will need to be carefully managed. There have been a couple of instances already in the last year or two that probably demonstrate this well (e.g. the Marmolada glacier in Italy last year).

Sea level budget divided into components, from Legeais et al. 2018 ESSD The steric component is the expansion of sea water as it warms.

The small glaciers are currently a larger contributor to sea level rise than the big ice sheets, but that will of course change as they disappear and even small amounts of sea level rise, as represented here, are important in coastal communities where storm surges can occur. So we definitely need to account for their loss in planning for sea level rise and extreme storm surges. Locally and culturally there will also need to be changes. I think this will be a little traumatic for some cultures which have always considered themselves “glaciated” nations. The response I see to pictures  of the current state of the European Alps where people are skiing on artificial snow in green fields is a case in point here. It’s a shocking thing to witness.

I include myself in the group who has to get used to the cultural shift.  I have worked on glaciers in the Alps and Norway which are really rapidly disappearing. It’s kind of devastating to see, but it’s not actually surprising. We have known it was coming and in many cases (including the authors of this paper), measured the massive losses (last year, 2022 was a disaster for the Alps and both Fabien Maussion and Matthias Huss who are co-authors on the paper are running very comprehensive programmes that show in real time how much of a disaster) and predicted it with some accuracy. But we’re now at the point where it’s really undeniable that these glaciers are going fast.

The Rhonegletscher in the timelapse above is a really iconic glacier in the Alps, I have my own favourites, mostly places I’ve worked, like Norway, Iceland and Greenland, which are all to a greater or lesser extent retreating fast now. The glaciers that people consider iconic or at least well-known tend to be accessible and depend very much where you are and they will be the glaciers we mourn over in the next decades. In the French Alps, it’s probably the Mer de Glace, in Switzerland perhaps Rhone glacier or Plaine Morte (both have monitoring programmes), in Canada perhaps the Malaspina or Athabasca glaciers. There are still (just) glaciers on Kilimanjaro and Mount Kenya, the Ruwenzoris are basically gone, as are the Papuan glaciers.

One of the longest records anywhere in the world for glacier length change is Nigårdsbreen in Norway. This plot was put together by NWE: The Norwegian Water directorate who monitor a number of glaciers

Though they show in the study that ice loss is basically linear with temperature, at some point the glaciers become so small that the remianing melt is highly non-linear. And these won’t grow back under any sensible “overshoot” scenario (never mind that we don’t really have technology to remove carbon from the atmosphere at scale). Once they’re gone, they’re basically gone forever on human timescales Finally, I’d like to add a bit of anlaysis by Ben Marzeion and co-authors , it’s possible to basically put a number on the amount of melted glacier ice each kg of CO₂ leads to.

We find that under present-day climate conditions, every emitted kg of CO2 will eventually be responsible for a glacier mass loss of 15.8 (5.9–20.5) kg. Again, since the global glacier mass is decreasing with increasing temperatures, this number is greater for lower temperatures and smaller for higher temperatures.

Marzeion et al., 2018

It’s past time to stop burning fossil fuels.

Literature searching the Fediverse …

Although I’ve had an account on mastodon since 2017 it’s only since the great Twitter migration that I’ve been using it and – I like it! (You can find me there as @ruth_mottram@fediscience.org )

I definitely don’t see it as a like-for-like replacement to twitter, what I miss from the bird site (as the denizens of the fediverse refer to it) is the breaking news (though even that seems to be under threat). However, when it comes to useful information, new tools, papers, in-depth discussions on scientific interests, Mastodon is winning every time, certanly compared to twitter now. It reminds me very much of how the birdsite was in the early days (though I’ve only been on since around 2011). It requires a bit more work to find the good stuff, and I may write something about that soon.

Anyway, an interesting discussion arose this weekend that I want to document and book mark here. Last week at work, our research group had a discussion about subscriptions and literature searches, specifically in relation to the costs of Web of Science, google scholar and connected papers.

Then on mastodon at the weeked, Carl Bergstrom (a recommended follow on #ScienceMastodon) posted about some of the issues with looking for material and in particular the potential issues with Google scholar, I replied with a link to the connected papers site. I really like the concept of connected papers and I find it an easy and intuitive tool and apparently an effective one if I see the suggestions for one particular paper I have recently been reading (see an example below):

Back on mastodon and suddenly the suggestions came pouring in! In particular Nika Shilobod has some intriguing suggestions visit the link to click on them all.

https://fediscience.org/@NikaShilobod/109417970053276603/embed

In Mastodon you can bookmark posts, so I have saved this one for future reference as I start to build a reference library looking at ice melange for my next paper. The issue has an extra relevance as the extortionate fees that publishers charge libraries is now starting to have real effects even in rich countries like Denmark where we were recently warned that we may lose full access even to very high profile journals Nature unless some reasonable agreement can be made between the universities and the publisher. (This article in the guardian is particularly eye-opening on how we got here!)

As a result I found these particularly useful links:

The openaccessbutton.org website allows to search the internet for free copies of papers – and if they don’t exist will ask the author to provide them. Helpfully, there is even a chrome extension.

Interestingly, and going back to the original point, the internet archive is now also running a scholar type search tool to find articles. To compare them side by side, here is a search I did on the google tool, compared with the same word search on the internet archive tool. Both came up with pretty similar references and neither appeared to be missing anything significant.

So all of this pretty much confirms my initial impression of mastodon, and indeed the fediverse in general – there’s an enormous amount of good stuff out there, and this seems liek a really good way to find it.

For more links and suggestions, check out the replies to the original toot stream

Long live the fediverse…

Sea Level Rise: How far, how fast?

A paper appeared in Science this week about sea level rise in the last interglacial (about 129-116,000 years ago). It has sparked the usual predictable headlines as it points out that during that period, sea level rose by about 6-9 metres but that that the ocean temperature as far as it can be reconstructed, is about what we see now, that is about 0.5C warmer than the preindustrial.

sealevelguardian
Guardian reports on latest study

In a sense this isn’t that “new” – we’ve known about higher sea levels during the last interglacial for ages and that the global mean temperature was roughly 2C above the pre-industrial global mean. This is in fact one of the reasons for the Paris target (though some scientists speculate that it’s also pretty much already out of reach).

However, the sea surface temperature stuff makes it extra interesting as the ocean is a pretty big source of uncertainty in global climate models and mot models do not manage to reproduce modern day ocean temperatures all that well.

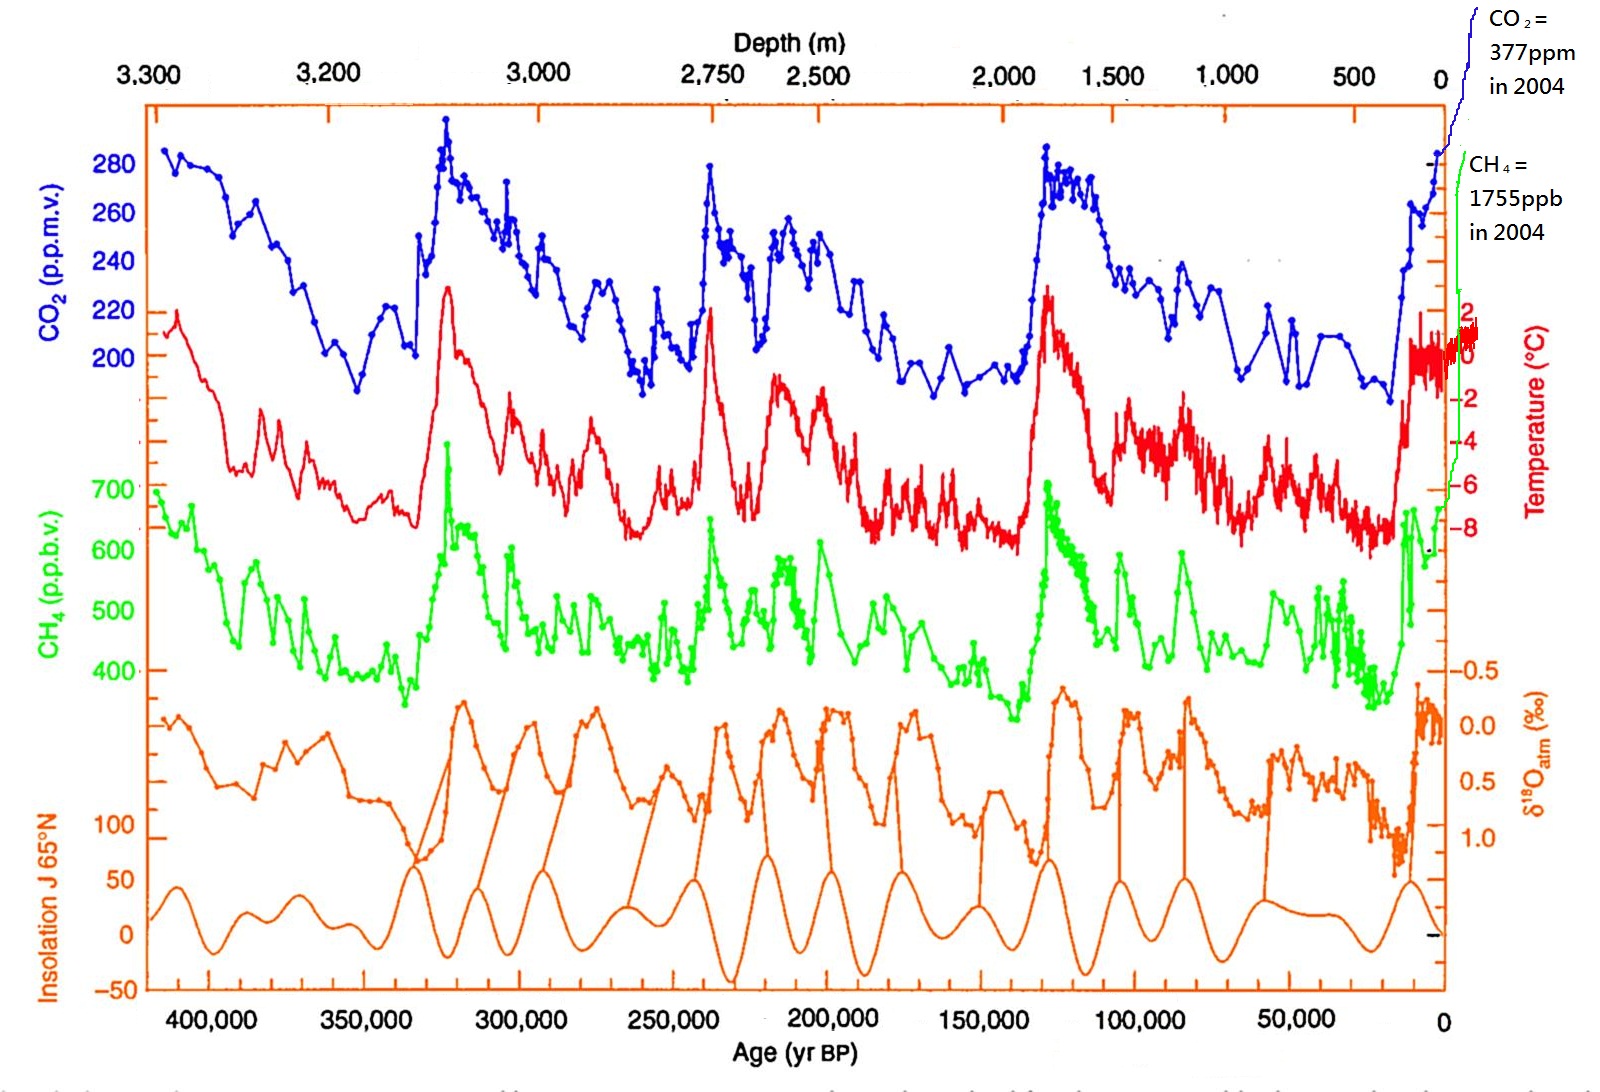
It should also be said that the last interglacial is only a good analogue for 2C world up to a point – it was warm because of enhanced solar input, not because of greenhouse gases as this plot from an Antarctic ice core, edited by the awesome Bethan Davies at the Antarctic Glaciers blog shows:

vostok_420ky_4curves_insolation_to_2004
Carbon dioxide (CO2), Methane (CH4) with reconstructed temperature from the Vostok Ice Core, taken in Eastern Antarctica. Enhanced with modern methane, CO2 and temperature measurements by Bethan Davies. Note that the “modern” value of CO2 here is from 2004. In 2017 it is currently measuring 403 ppm.

It’s also interesting to speculate where the water came from – the Greenland ice sheet was much smaller than today but it was still there and now “only” contains 7m of sea level rise today. So the complete disappearance of Greenland cannot explain the rise in global sea level. The small glaciers and ice caps of the world can’t contribute more than half a metre or so either. Therefore it has to be Antarctica contributing the most – East or West is the question and it really is a very very longstanding question.

The progress in the international polar year (IPY) in mapping the bedrock of Antarctic in the BEDMAP2 brought quite a few surprises, including the discovery of several very deep marine basins in the East that could potentially contribute a lot of water to sea level.

More recently, channels under the floating ice shelves of west Antartica, along with various modelling studies have proposed that the west could be much more unstable than thought. Actually this has been a very very longstanding problem in Antarctic science since at least the late 1970s when John Mercer first proposed the marine ice sheet instability hypothesis.

In any case, events in both Denmark and the UK have brought this problem home more sharply.

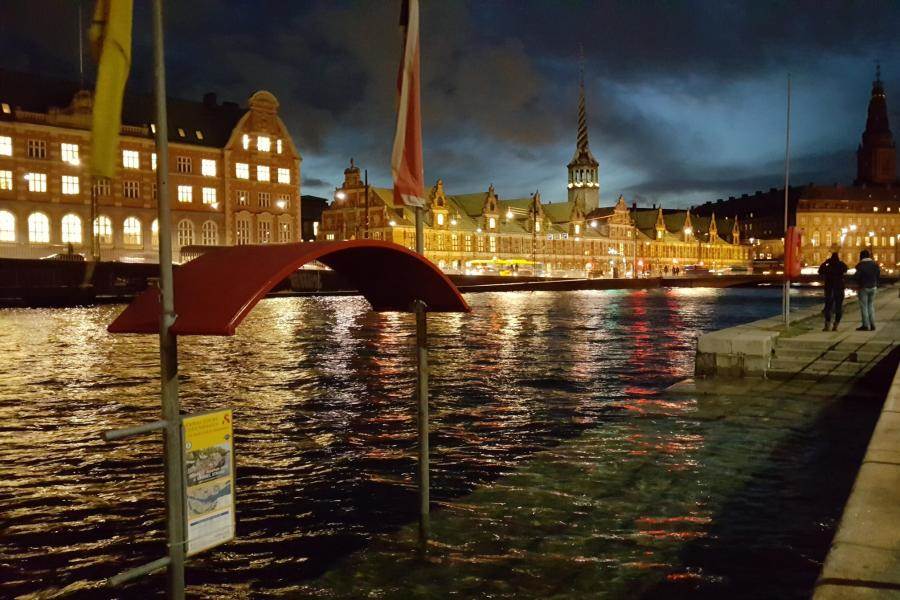
stillstormflod
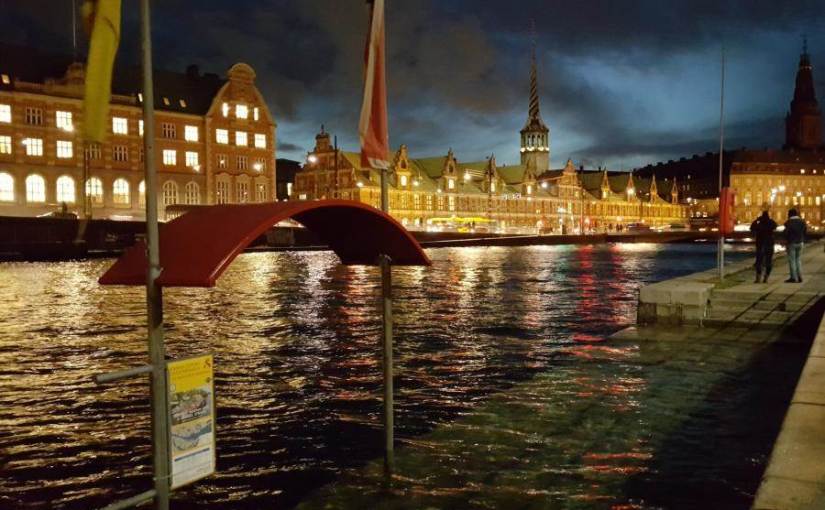
The silent storm surge – coastal flooding in Copenhagen on the 5th January – the water in the harbour is not normally this high! Source: Brian Dehli, shared by DR 

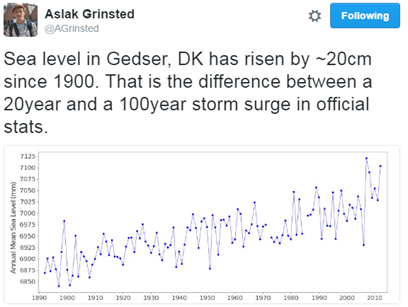
aslaktweet

The “silent storm surge” in January 2017 around the coast of Denmark was  a hundred year event in many places, but as Aslak Grinsted points out, sea level rise makes a hundred year event a 20 year event with only a small rise.

Sea level will not rise equally everywhere, the fingerprint of Greenland ice sheet loss is felt largely in the Pacific, Antarctic ice melt will be felt in Europe. It matters where the water comes from. A point not generally appreciated.

So this new paper is also important, but it only underlines that we need to be able to make much much better estimates of how fast and how far the ice sheets will retreat, which is the justification for much of my own scientific research.

Finally, I think it’s probably necessary to point out that sea level is already rising. This was asked by a listener to Inside science, one of my favourite BBC radio 4 programmes/podcasts. I was a little surprised that an apparently scientifically literate and interested member of the public was not aware that we can measure sea level rise pretty well – in fact to an extent, the global warming signal is more easily detected in the ocean than in the global temperature record. This is because the ocean expands as it warms and there is ocean pretty much everywhere, whereas temperature observations are patchy and mostly on land. Clearly, scientists like myself are *still* not doing a very good job of communicating our science more widely. So here is the global mean sea level record to date, it’s updated pretty regularly here and on average, sea level is rising at about 3mm per year or 3cm per decade.


sealevel
Sea level variation measured by satellite since 1993 from NASA

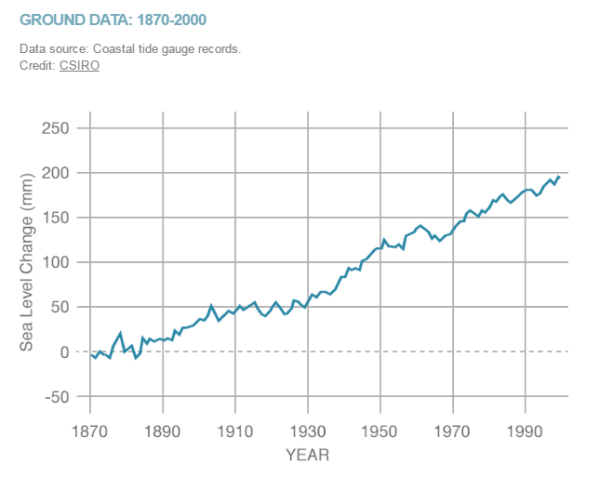
When we look at tidal gauges,sea level rose about 20cm in the 2oth century

20crsealevel
Sea level rise in the 20th century measured by tide gauges, plot by NASA, data from CSIRO

The big uncertainties we have on whether or not this will accelerate in years to come is largely down to missing processes in ice sheet models that we don’t yet understand or model well – mostly calving by glaciers and ice shelves. I promised Steve Bloom a blog post on that at some point – I have a paper to finish and new simulations to run, but hopefully I’ll get round to that next.

UPDATE: I was made aware this morning of a new report from the European Environment Agency about climate change impacts and adaptation in Europe. In the report they state (correctly) that while the IPCC 5th Assessment Report suggested that in the 21st century the likely sea level rise will be on the order of half a metre, some national and expert assessments (I took part in a couple of these) had suggested an upper bound of 1.5 – 2m this century, for high emissions scenarios.

This is a big difference and would be pretty challenging to adapt to in low-lying countries like the Netherlands and Denmark, not to mention big coastal cities like London or Hamburg. It’s laso important to emphasise that it doesn’t jsut stop at the end of the century, in fact our simulations of the retreat of Greenland ice sheet suggest it’s only just getting going at the end of this century and the next century the rate of ice loss will really start to accelerate.

All of which is to say, there’s really a very good reason to act now to reduce our emissions. The EEA has also produced this very nice map of observed sea level rise in Europe over the last two decades based on  Copernicus environmental data.

Obs_slr_Europe.png
Check out how much the sea level is rising where you live… Source: European Environment Agency, data from Copernicus Marine Environment Monitoring Service

With the prospect of American federal funding for environmental observations being reduced or strongly constrained in the future, it’s really important we start to identify and support the European datasets which are the only other sources of environmental monitoring out there right now.


The Unicorn and The Lamprey

On the 16th may 1619 two ships, the Unicorn and the Lamprey, set sail from Copenhagen searching for the fabled North West Passage. On board there were 65 men, led by their captain, the Danish explorer Jens Munk. A year and a half later, the Lamprey limped back into Bergen (Norway) with just 3 men, including Munk, on board.

Almost all of the other crew members had died of scurvy in Hudson Bay .

The story of this terrible voyage, their sailing round Iceland, Greenland, Baffin Bay and into Hudson Bay is outlined in this wonderful atmospheric podcast from DR.

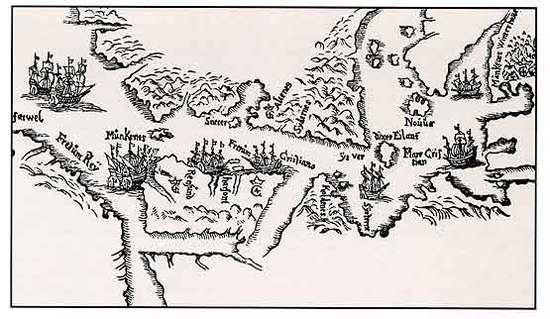
jens_munk_map_1624
A Map, hand-drawn by Jens Munk in 1624 of the area between Cape Farewell and Hudson Bay, seen from the north; (Source: Tromsø University library)

The UK has similarly many tales of Arctic and Antarctic suffering, listening to the podcast I was put in mind of Coleridge’s famous “Rime of the Ancient Mariner”, but we rarely hear of the similar stories from other nations, a clear benefit of learning other languages is being able to access these archives and stories*.

The podcast contains a wonderful description by a Greenland pilot of the sea ice and how tricky navigating it can be along with interviews and inputs from many others. If you are at all familiar with Danish – I really recommend the series.

However, the description by a nutritionist of the terrible effects of scurvy had me wondering. I learn (via Dutch family and confirmed by the OED) that the name of the disease, caused of course by a lack of vitamin C in the diet, is probably from the Dutch Scheurbuik – rip belly – an eloquent description of one of the notable later stages of the disease.

Rip here is less a description of enhanced musculature and much more a description of what it feels like when your internal organs start to bleed and your muscles and bones are weak from lack of nutrition.

asm-30-325-g002
Photo of chest cage with pectus excavatum and scorbutic rosaries – from this paper

Upon looking it up (Thankyou Wikipedia), I learn that the causes of scurvy had been repeatedly identified, forgotten and mistaken since at least the middle Ages. There is an estimate that around 2 million sailors died as a result of scurvy between 1500 and 1800.

2 Million almost entirely preventable deaths and 2 million men who died in appalling agony.

And this happened in spite of what appears to be the first recorded medical trial by James Lind in the 1750s, it still took the Royal Navy 40 years to start giving out fresh citrus fruits as a standard on their ships. Vitamin C itself was only finally recognised and extracted in 1932.

This story is an outrage in many ways, but a clear example also of how science and medicine, properly conducted, can help to improve and save lives. It is also a clear warning to conduct thoughtful experiments with care and to listen to those warnings when they have been issued.

It might also be a recommendation that learning foreign languages is not only fun and useful but can be it’s own reward.

*I should also mention here that the rather awesome Danish Arctic Institute are currently producing a very well written series on Danish exploration in the Arctic in English, based on their own very comprehensive podcast series. These are published online in the Arctic Journal. Both the series of historical accounts and the newspaper in general are absolute top recommends for those interested in the subject of the Arctic environmentally , socially and politically.

dsc_57
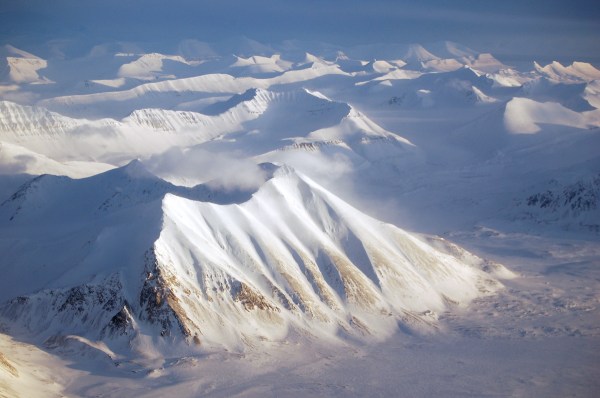
The lure of the poles (Svalbard in Spring, the coldest time of year)

Extract from “Rime of the Ancient Mariner” by Samuel Taylor Coleridge

…With sloping masts and dipping prow,
As who pursued with yell and blow
Still treads the shadow of his foe,
And forward bends his head,
The ship drove fast, loud roared the blast,
And southward aye we fled.
And now there came both mist and snow,
And it grew wondrous cold:
And ice, mast-high, came floating by,
As green as emerald.
And through the drifts the snowy clifts
Did send a dismal sheen:
Nor shapes of men nor beasts we ken—
The ice was all between.
The ice was here, the ice was there,
The ice was all around:
It cracked and growled, and roared and howled,
Like noises in a swound! …”