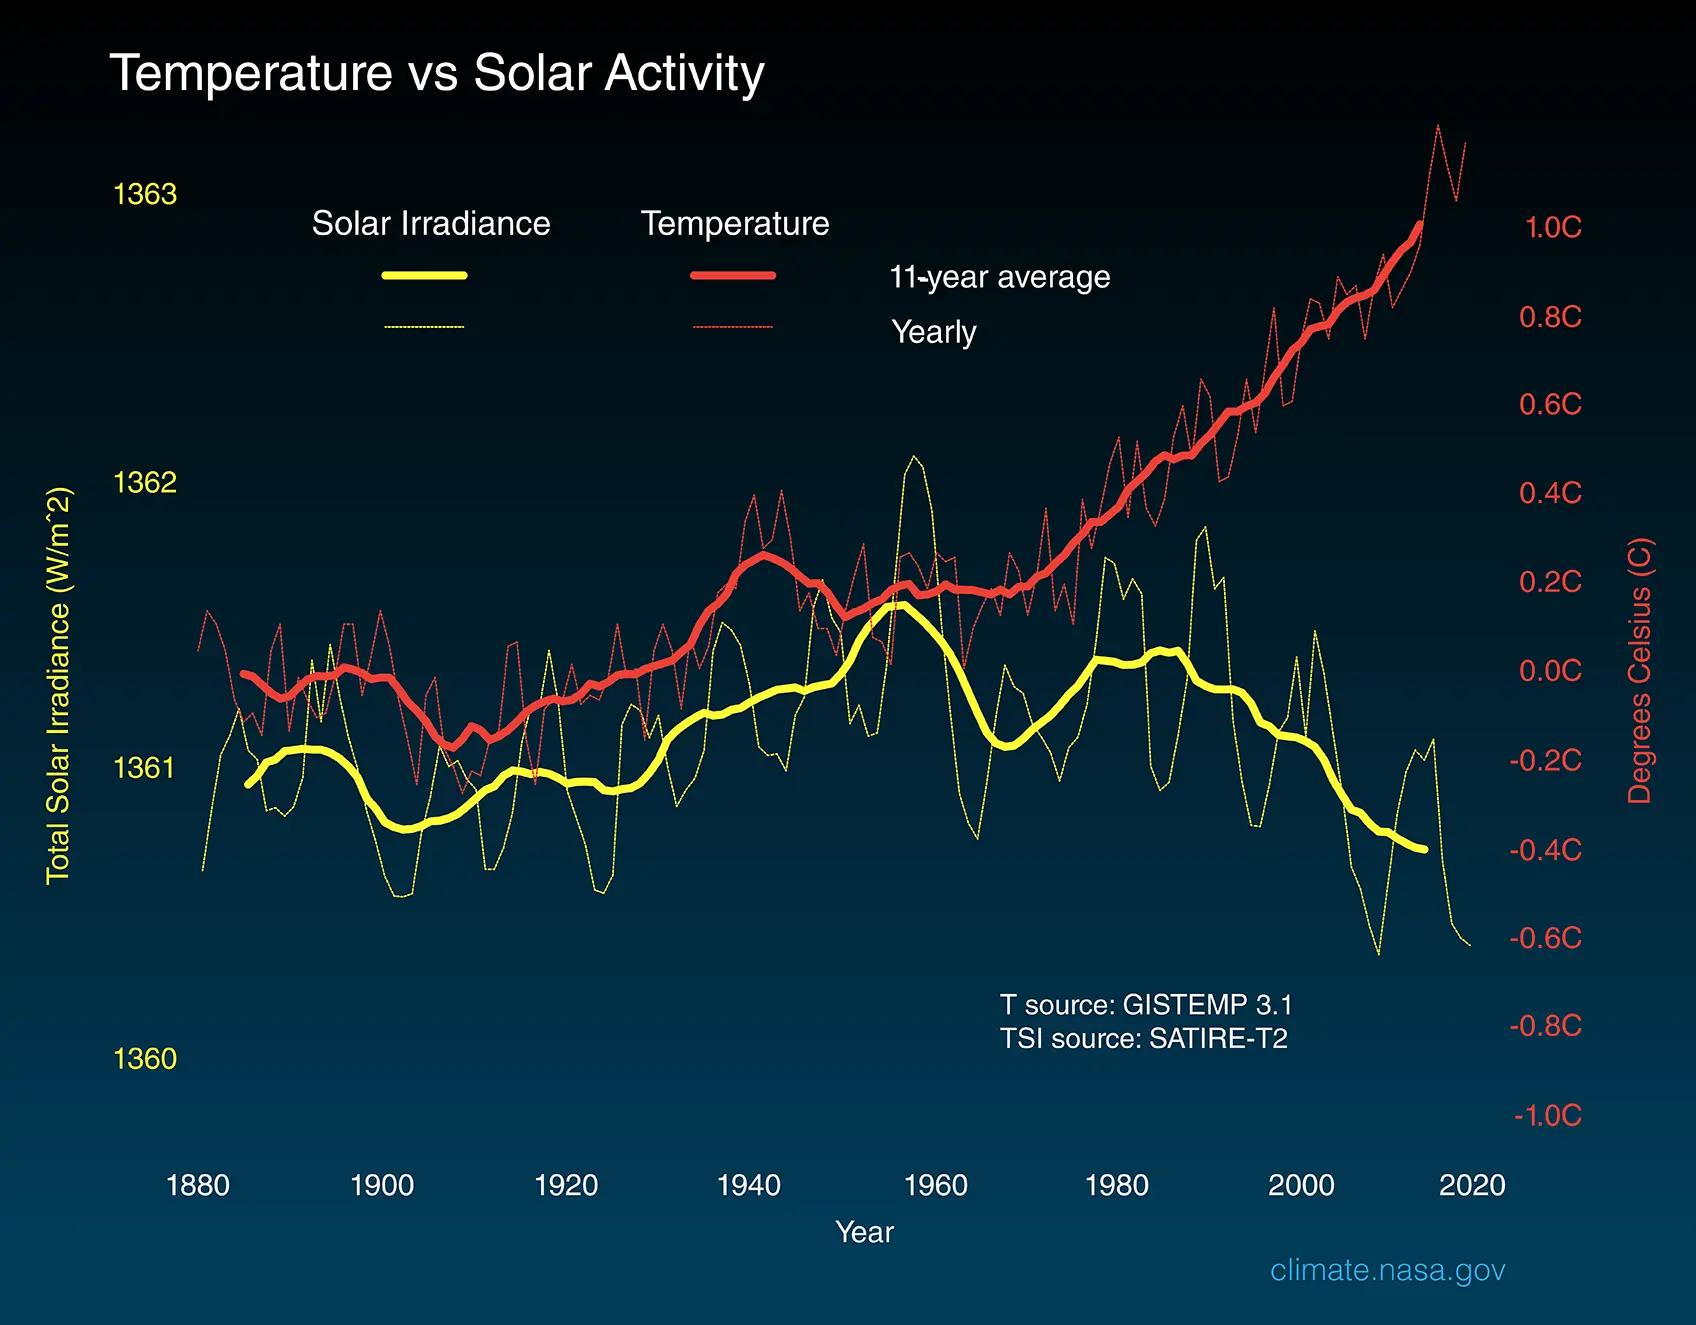
It’s a really thorough introduction to the climate system and all the natural sources of climate variability and cycles of change, including links to sources. Well worth taking your time over with a morning cup of tea and probably I’ll assign it as an introduction text for BSc students (and management) on the big picture of climate change.
I also love it for the introduction where multiple eminent and respected scientists are asked what they’d buy with all the dollars they’d have if they were given one dollar every time someone asked them about “natural climate cycles”. As you might expect, the answers range from heat pumps and solar panels to new bicycles and a time machine.
Not sure what I’d use it to pay for, possibly a new postdoc position to work on snow and ice processes?
*as an aside: I haven’t read Ars Technica in ages. And it’s funny because I remember that when I first started on twitter way back in 2010 there were *a lot* of good articles shared from there on the bird site. Somehow they either were not shared or got suppressed and I stopped seeing them. I’m not sure if that was due to the algorithm or different people I was following. One of the nice things about mastodon is that without an algorithm (and crucially, by following *a lot* of people!) there is a chance to see a much greater diversity of different media. It feels a bit like seeing a different internet, outside the standard walled garden.
Currently, I’m very busy getting ready with colleagues to travel to Greenland next week. We have an extremely full programme of fieldwork activities covering oceanography, biology, sea ice, snow and glacier processes as part of our NCKF work. More on these no doubt in a future post…
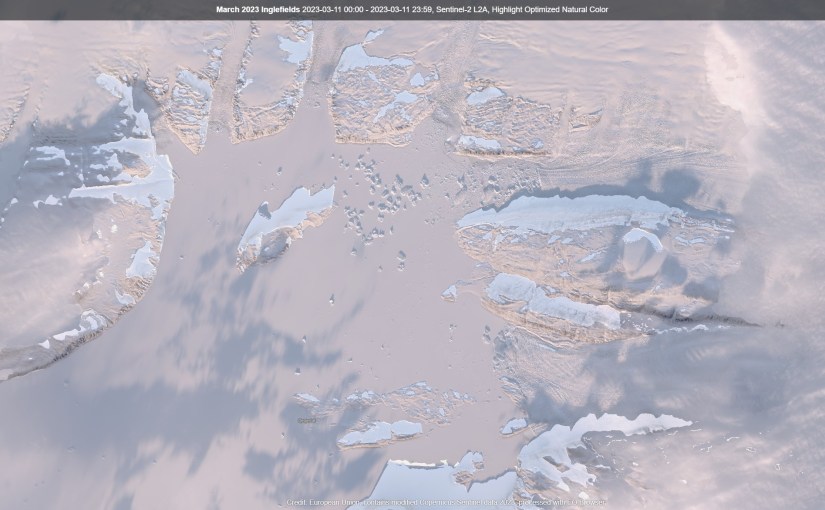
Yesterday, one of my ace DMI colleagues (without whom most of the work we plan would definitely not happen) shared the first optical satellite image of the area this year – taken by ESA’s Sentinel 2 (a truly astonishing source of free imagery and everone should know about it). Because the area is very far north, it has been in the Polar night until now so we have been reliant on the ESA Sentinel 1 imagery based on radar.
First Sentinel-2 optical satellite image of the year downloaded from Sentinel Hub’s EO Browser today. Processing with Sentinel Hubs optimised natural colour filter has introduced some artefacts, notable the brigh white patches which probably represent areas of shadow due to the low solar angle. The area is blanketed in thin cloud and only parts of the glaciers, sea ice and icebergs are clearly visibe.
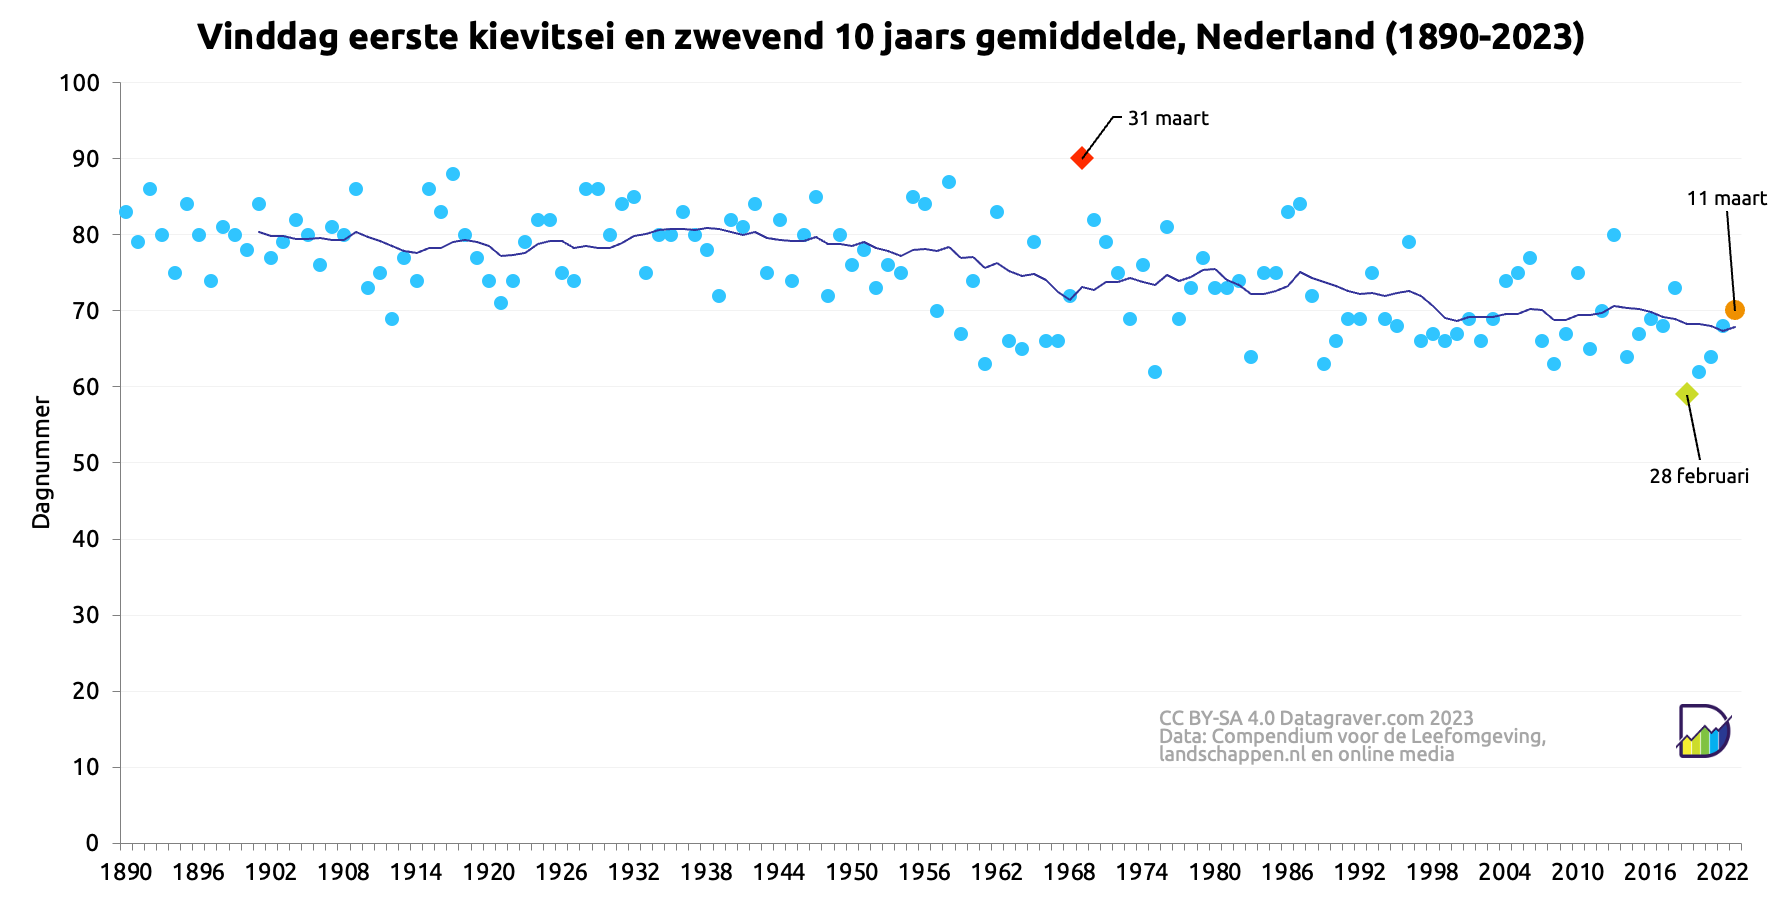
Where biology is clearly showing us earlier springs due to climate change, the date of the first optical image is unlikely to change any time soon due to climate change.
I’ve been on holiday this last week and I’m combining the trip to the UK with a visit to colleagues and collaborators at the University of Leeds. I’ve also been nabbed while I’m in Leeds to give a wider interest talk at the Royal Meteorological Society Yorkshire branch in Leeds.
I’ll be discussing ice sheets, their contribution to sea level rise and how the future is looking. There may also be some nice photos from our fieldwork in Northern Greenland for those who like dogs, icebergs and snow…
If you’re in Leeds and fancy joining you’re most welcome to register and attend at this link.
In general, I’m trying to reduce my travel this year, last year, with all the rolled over meetings from the COVID times was disruptively busy with work travel, it makes it challenging to actually get the work done. So I think combining work and holidays and rolling up meetings into a block is the way forward.
Although I very much appreciate the opportunity to present online at various meetings, I’m less convinced about hybrid meetings where the purpose is mostly scientific discussions, that is something that works much better either all online or all in person in my opinion, but I think they work well when the aim is to present new and ongoing work (like EGU).
For those who are interested but can’t attend I will see if the talk tomorrow will be recorded and can be uploaded somewhere. Here’s the abstract:
Frozen Threats: Understanding the Role of Ice Sheets in Sea Level Rise
In this talk, we will delve into the world’s ice sheets and explore their importance in the climate system. Ice sheets are the largest stores of freshwater on the planet, their size and location means they influence our climate but their interactions with the atmosphere and ocean are complex. As the world warms, they will inevitable have an impact on sea level. Adapting to sea level rise will be one of our civilisations biggest and longest challenges, so understanding ice sheets is now of critical importance. They are also beautiful and fascinating environments in their own right. In this talk I will discuss some of the scientific challenges, but also show how far we have come in understanding ice sheets and glaciers.
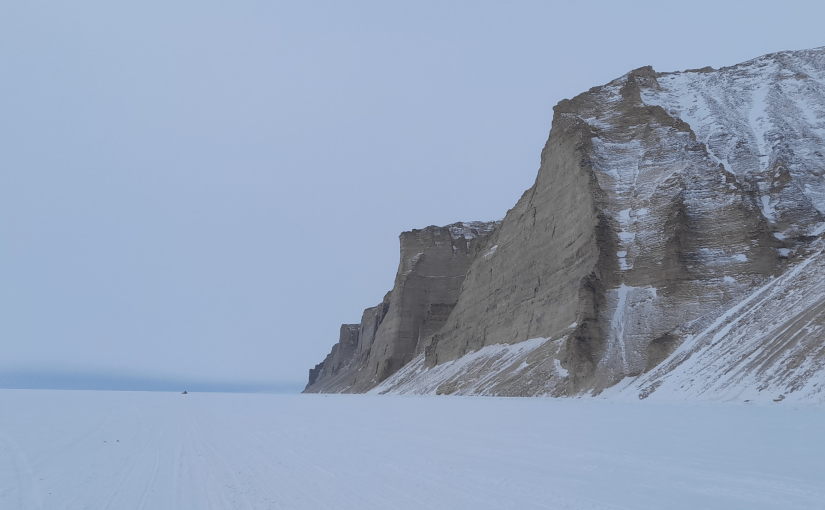
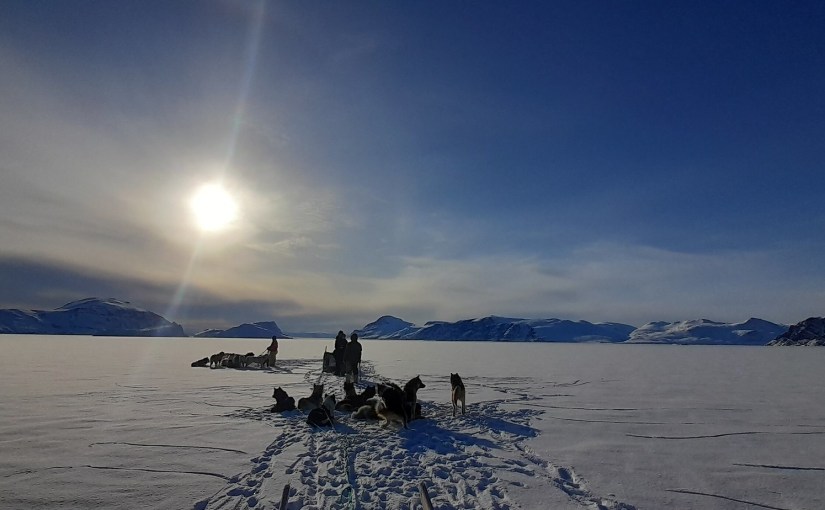
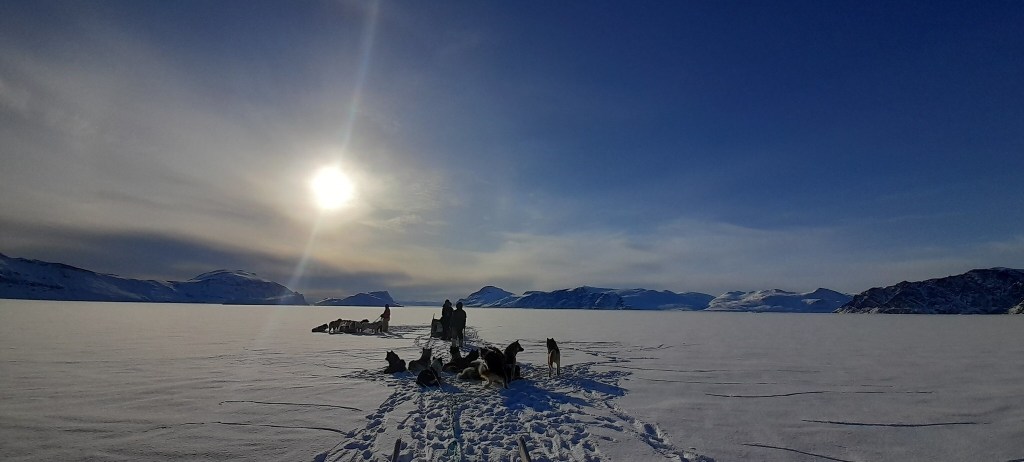
The Inughuit cliffs near Qaanaaq in Northern Greenland rising up above the sea ice. In the far distance a dog-sled is a small black speck.
War is not merely a political act, but also a real political instrument, a continuation of political commerce, a carrying out of the same by other means. All beyond this which is strictly peculiar to War relates merely to the peculiar nature of the means which it uses.
But most of all I’m reminded of Gary Kasparov’s declaration that the point of modern propaganda is not to make you believe something but it’s to make you believe nothing. (I paraphrase slightly). Much of the piece is about how the Russian propaganda operation as been so successful at engendering doubt about Ukraine and the state of relations between Russia and Ukraine.
I sometimes feel the invasion of Ukraine has really been a wake-up call for many of us because it’s just so undeniable. An actual event happening to real people that we know with a pretty clear narrative. The genius of Russian influence operations has always been to muddy the waters sufficiently that it was a little hard to trust anything that anyone said or wrote.
In this sense I’ve also found Timothy Snyder’s series on the making of modern Ukraine (which I’ve been listening to over the last few weeks) brilliant and helpful and interesting. The subject is fascinating, but it also because it becomes clear listening to a historian that, yes there can be different ways to interpret events, but the events themselves are real and we have a duty to try to learn the facts before judging them.
This is of course exactly how scientists should think, that we have to establish good observational data before trying to interpret it. We also need, inevitably to consider what are the uncertainties and likely range within that data. What is missing? What can’t we know? What is the most likely interpretation based on the things we can observe? How reliable are our measurements?
One of my favourite teachers at school who really helped to develop the way I think was very clear on how to do this. And he was not a scientist, he was a historian.
Ultimately, I was more interested in understanding the physical world and went on to study glaciers, ice sheets and the climate system at the poles. However, as I’ve been focusing more on sea level rise and how on earth we adapt to a changing climate it’s quite clear that going back to the social sciences will be important to understand human behaviour. And the murky way other actors seek to influence us as we adapt to climate change is also going to be important to understand. There has been undue influence from a “Merchants of Doubt” perspective for sure for many years when it comes to the causes of climate change and the effects. This is very clear in the mess of climate denial that the new Lord of Twitter has unleashed, it’s a little bit like returning to 2009.
Anyway, this is a bit incoherent maybe. But it’s a great piece for clarifying what we know now and maybe for working out what comes next in terms of Russian interference in democratic institutions. And from a climate scientist perspective it’s also another reason to try to avoid (if we can), becoming just another cultural battleground. This is also key: it’s not always about money, sometimes people really are being manipulated for other reasons:
“When people act in the interest of a foreign power, it is sometimes for money, it is sometimes because the foreign power knows something about them, it is sometimes for ideals, and it is sometimes for no conscious motive at all — what one thinks of as one’s own motives have been curated, manipulated, and directed. It seems quite possible — I raise it as a hypothesis that reasonable people would consider — that some mixture of these factors was at work at FBI New York in 2016.”
One of the advantages of being part of a research institute are the fascinating conversations that happen over lunch between colleagues working in different areas. Today was a classic with conversation ranging from the stratospheric effects of the Hunga-Tonga eruption to the different types of snow crystals that form in snow packs and their impacts on sea ice. However, the conversation started with a request to me for some rules of thumb on sea level rise, so here they are:
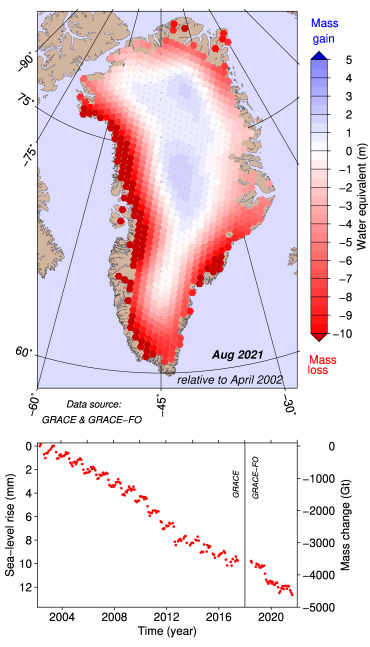
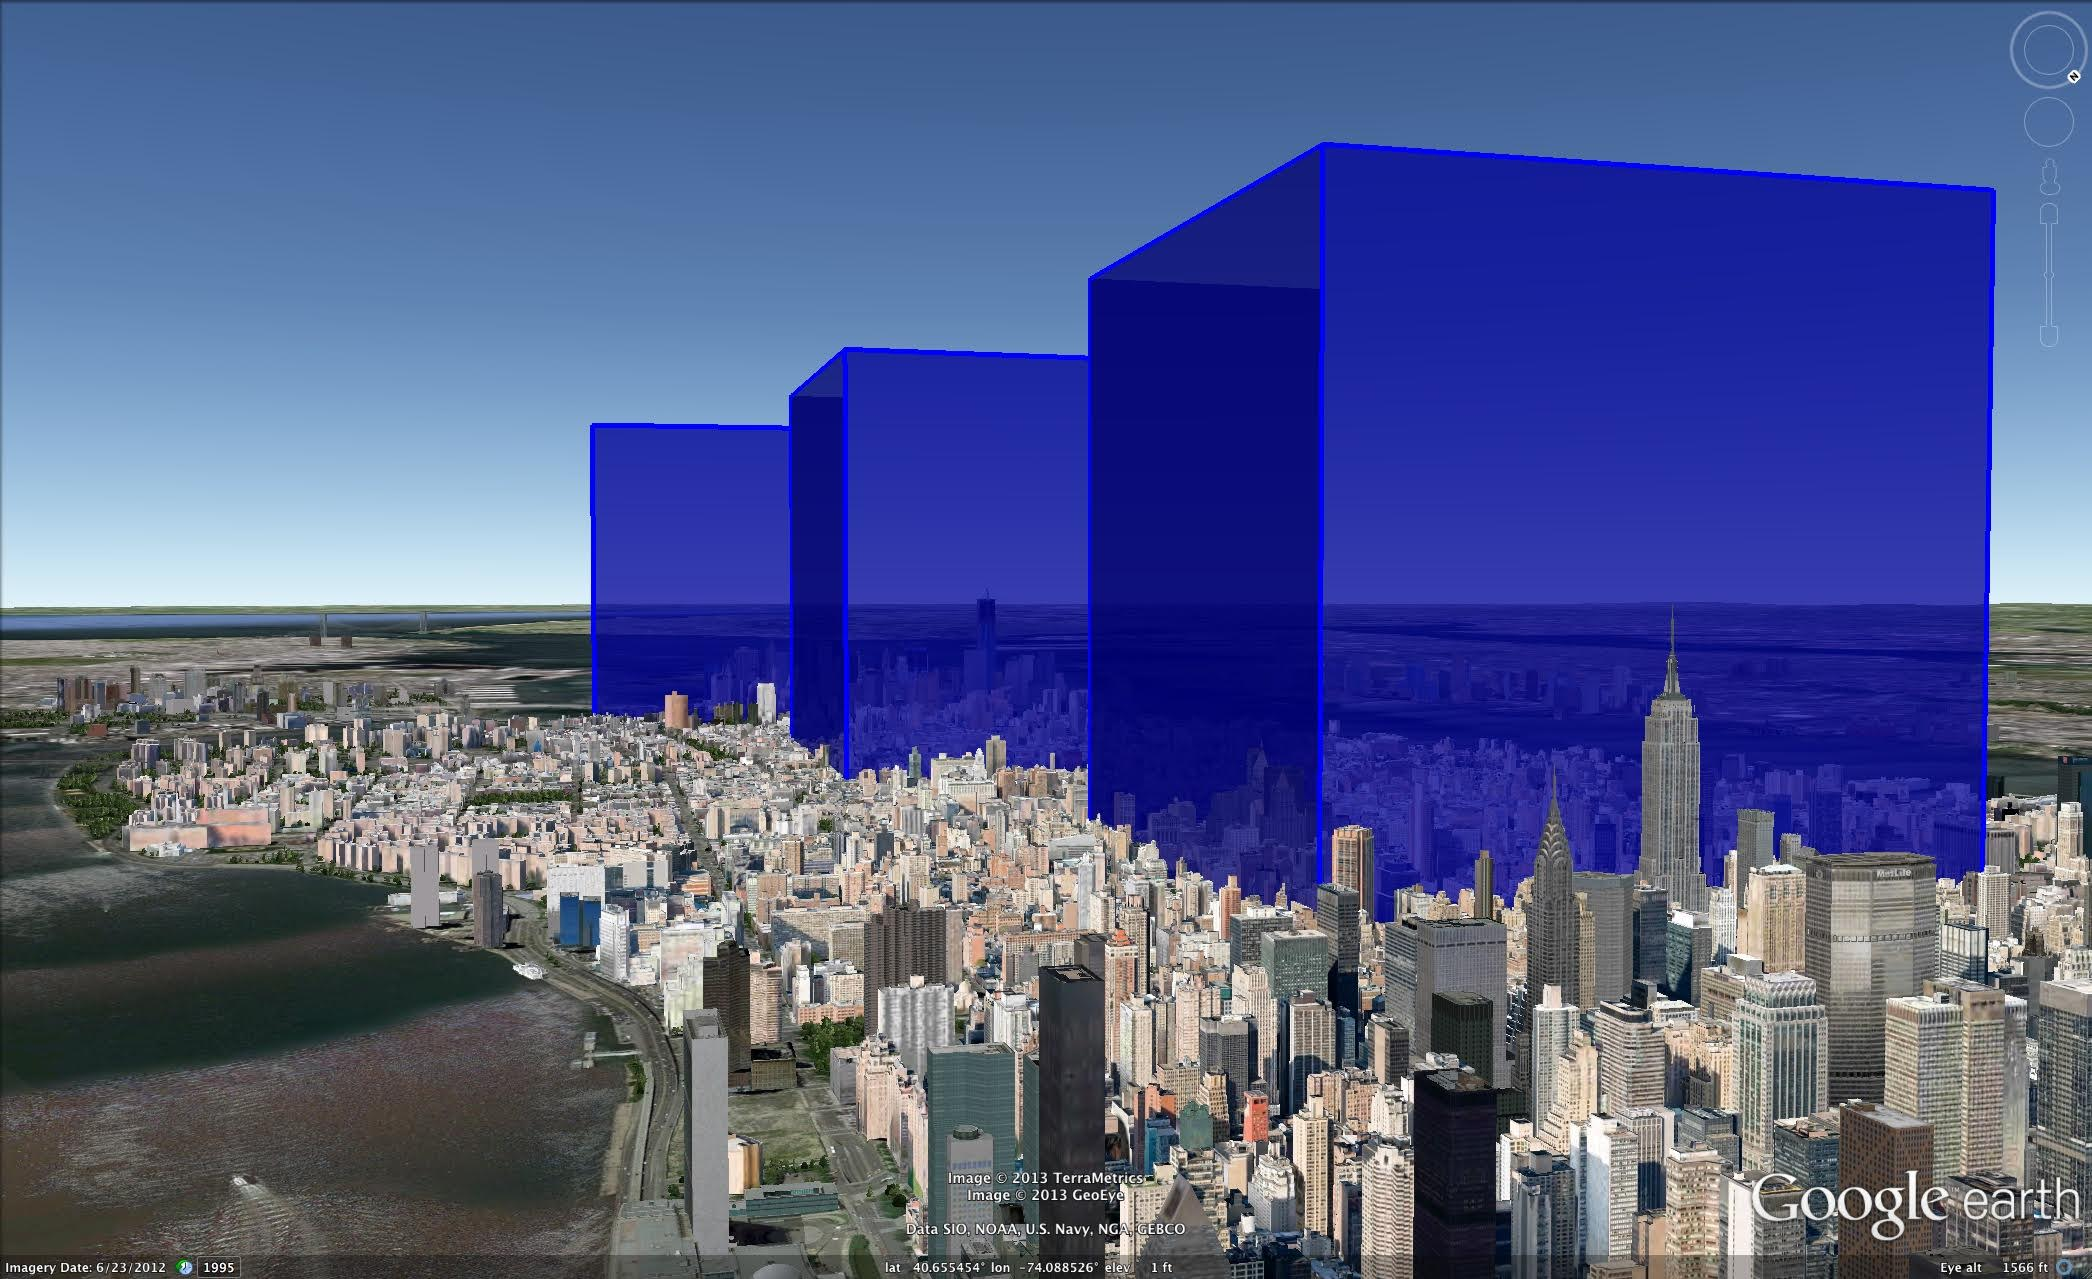
The Greenland ice sheet loses on average around 250 to 280 Gigatonnes of ice each year – that’s from all processes including melt and surface runoff, iceberg calving, basal melting and submarine melting.
The small glaciers and ice caps around the world contribute a bit more to sea level rise in total each year than each of the big ice sheets currently, but they will be quickly exhausted. As there are thousands of small glaciers, most of which are not well monitored, we have to estimate how these are changing using models. It appears that on avergae they add around 0.7 to 1 mm of global sea level rise each year.
The thermal expansion of the oceans is still the largest part of currently observed sea level rise but on an annual basis, the cryosphere now often contributes more.
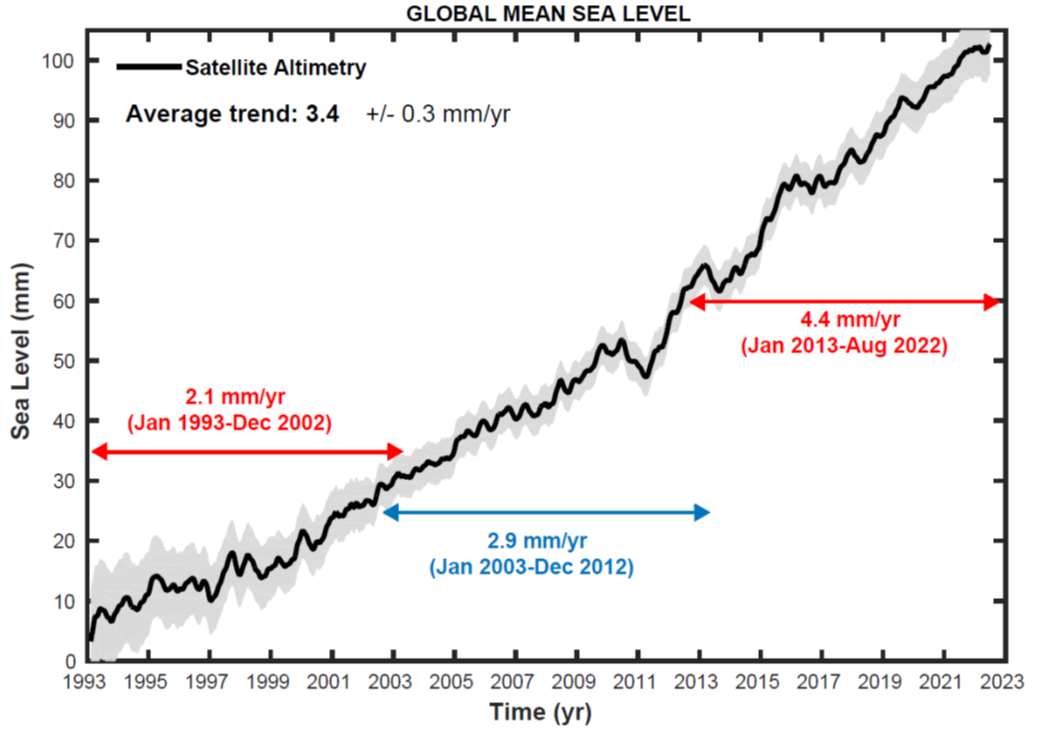
Since the early 1990s sea level rises about 3mm every year, but over the last 5 years it has been closer to 4.5mm per year. The curve over the last 2 decades has followed a quadratic shape rather than a linear shape – put simply, this means sea level is accelerating. The sea rose 10mm from January 2020 to August 2021.
An El Nino, which some are warning could occur this year, may cause a temporary pause or at least slow down in sea level rise, even as global air temperatures increase, mostly due to the large amounts of rain that are associated with it, but this will only be temporary.
While the rate (3-4 mm per year) doesn’t sound like very much, every mm counts, increasing the risk of coastal flooding and storm surges affecting coastal communities.
Finally, global sea level rise is not distributed evenly, broadly speaking, the further away from an ice mass you are, the more likely it is to affect your local sea level, so Greenland matters less than Antarctica in Northern Europe.
NOAA’s visualisation of observed sea level rise from satellites in the background and at tide gauge locations (the round dots) since 1993, note the uneven pattern which reflects processes like ocean currents, atmospheric circulation and winds, local relative land movements and gravitational changes due to changing ice masses.
I hope these little rules of thumb help. Feel free to add more (or disagree) in the comments..
We will head to the field in Qaanaaq in late March with various instruments.
Update: It’s official now, I have booked my tickets, we have new instruments to deploy and a colleague and I are working on developing a new programme that we can hopefully also fit in alongside the currently planned programme. More on this at some point no doubt. The countdown has begun and I am getting into that fieldwork frame of mind.
I came across this blog post from old friend and former colleague, Karen Darke, who I’m now more or less out of touch with, unfortunately.
She is just back from her incredible Pole of Possibility expedition in Antarctica and she wrote this which I think perfectly summed up that expedition frame of mind..
It’s a really great blog post and well worth a read of the whole thing.
There are people and places I look forward to again but my soul is already grieving for expedition life, for the dualities that it brings: complexity and simplicity, space and confinement, alone-ness and together-ness, vulnerability and strength, connection and disconnection. I miss waking up huddled closely with my tent-mates and the time skiing silently in big open white-scape. I miss the detailed organisation of kit and systems and the contrasting uncertainty of every hour of every day. I miss feeling small and vulnerable as well as strong and capable. I miss the clear, invented purpose of every day.
Karen Darke, Pole of Possibility
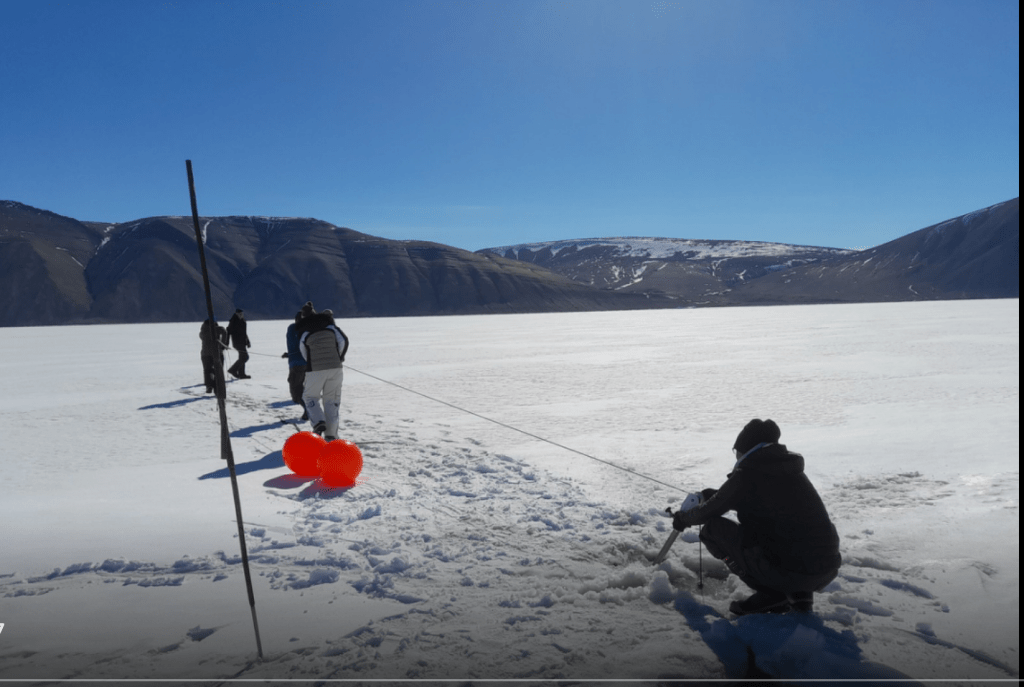
One of those moments on a fieldwork expedition when everyone is busy, drilling holes in the ice to send down a CTD, drilling a sea ice core to measure salinity, digging snow pits, deploying instruments. My DMI colleagues Steffen Olsen and Andrea Gierisch are the ocean and sea ice scientists driving this work in close collaboration with our Greenlandis friends, you can read more about their work here: ..
Our fieldwork expeditions are maybe a bit more frenetic than the pole of possibility has been (in some ways, probably not others). We are always racing against the clock and the weather to get as much work done as possible. We probably cover less distance and there is perhaps less physical stress as the dogs do the hard work of pulling, rather than skiing with human muscles. Nonetheless, there is a constant low-level thrum of thinking, planning, checking. Even if there are also often whole hours, where not much other than travel happens and that are extremely valuable thinking time. (And how often do we get that in the modern world?)
Unlike the Antarctic, working with local people in Greenland means that we also see the landscape as a working place, not just a white desert far away and as Karen writes, how true this is:
It is harder than we anticipated to leave, but Antarctica has been a reminder that we are adaptable, resilient, purpose-seeking, capable humans. No matter how harsh our environment may be, we seem to find ways to connect, collaborate and create ways to not only survive, but to thrive.
On a slightly different note, I had momentarily similar thoughts to Karen on the problem of despoiling the landscape with toilet visits the first time I visited Qaanaaq, before realising that when travelling with 30 dogs (as the local people have always done), the problem is rather moot. But as I have written before, it’s easy to fall into the trap of pristinism in the Arctic. Our work on the Arctic environment is a reminder that it really isn’t. Even in Antarctica, environmental pollutants from lead to microplastics have been found, while the curse of overfishing is almost as visible in the Southern Ocean as in the northerly just as climate change is also taking a toll.
But finally, I also find myself fully agreeing with the last part, because although fieldwork is often cold, uncomfortable, difficult, exhausting, boring and tiresome, it’s also often fascinating, rewarding and exciting. And the experience can change us.
Just as a photograph can’t always capture the profundity of a place or a moment, it is sometimes difficult to find words that describe how something has sculpted us. An experience can impact us so deeply that we don’t immediately know how to translate it for others. And may never
I am immensely privileged to be able to do fieldwork in Greenland and I am extermely grateful for the opportunity to do so.
I was recently asked to comment on this interesting new paper by David Rounce and co-authors for AP by Seth Borenstein called “Global glacier change in the 21st century: Every increase in temperature matters”. You can read his resulting summary here . I’m posting here the slightly expanded and lightly edited response I sent to Seth in response to his (very good) questions.
The authors only look at the small glaciers and ice caps in this study, not the big polar ice sheets, though they do also cover small peripheral glaciers in Greenland and Antarctica that are not part of the main ice sheets. Of course, this means that sea level rise from all the other important processes like thermal expansion and ice sheet met also have to be taken into account on top of the numbers given here.
Their main findings were that at 1.5 °C above preindustrial, we can expect total glacial mass loss between 2015 and 2100 would be 26% with 90 mm of sea level rise and 49% of the small glaciers and ice caps lost globally. The paper only deals with these small glaciers and does not count the big ice sheets!
At 4°C, we’re looking at 41% mass loss with ~154 mm of sea level rise and 83% of glaciers lost. At 2.7 °C, where the world is now heading, 32% mass loss, 115 mm of sea level rise and 68% of glaciers lost.
I’m sad to say that the results aren’t exactly a surprise – the community has known for some time that the loss of glaciers is basically linear with temperature, so the title of the paper is really spot on, every tenth of a degree really does matter. This earlier paper by my Horizon 2020 PROTECT project collaborator Ben Marzeion shows something very similar But it’s a nice new result with the latest generation of glacier model and updated with the latest CMIP (IPCC) scenarios and they included some new processes that weren’t very well accounted for in previous work.
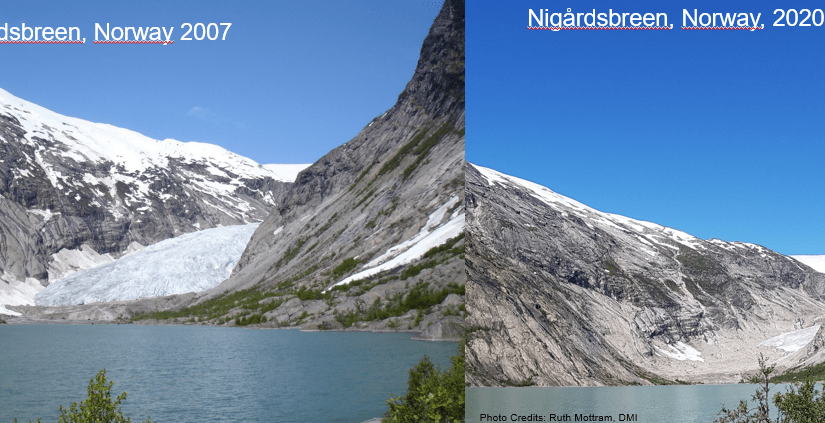
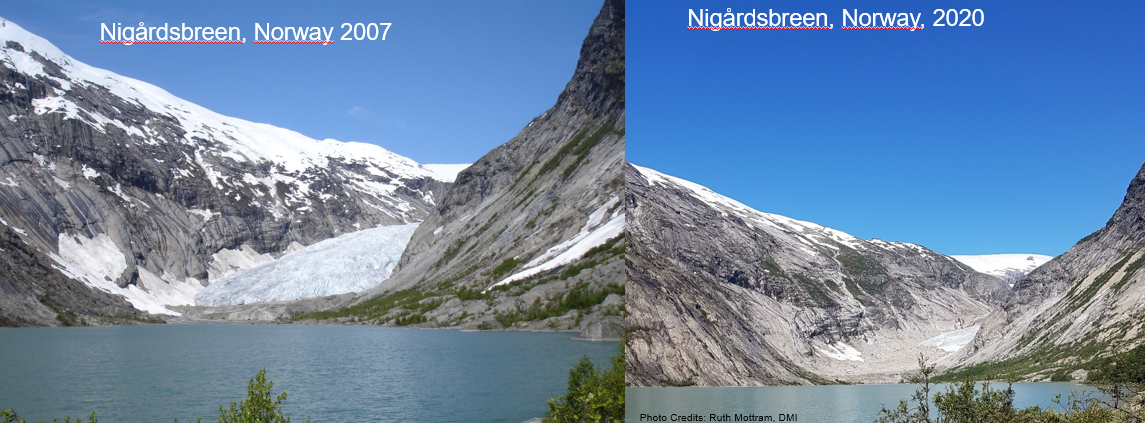
My first thought was that these latest estimates were actually a little lower than I expected, but the baseline in the paper is 2015 – we should remember that many of these glaciers have already lost quite a lot of ice (see my two photos of Nigårdsbreen in Norway, taken only 13 years apart) – so the new estimates are basically in line with what I would have expected given earlier work. I’d also expect that they will continue to lose ice beyond 2100 so it’s definitely not an end state that they are giving here. As they state in the article there will be widespread deglaciation of some pretty iconic parts of the world, even under the present planned emissions reductions..
In many ways part of the problem has been the previous studies have not always accounted for all the processes: frontal ablation (melt and calving of vertical ice cliffs, mostly in contact with water), the effect of debris cover and so forth (the latter will likely reduce the rate of loss, the former probably increases it). Given what we know about these processes and how to represent them in models, I still consider this work to be a more realistic estimate. Then we also need to account for the climate models and the scenarios used to force them – there are some important differences between CMIP5 and CMIP6 which might also account for some of this shift. We have actually seen something somewhat similar for the projected changes in the big ice sheets.
It’s probably important to remember though that this study still needs to make simplifications, especially when looking at so many glaciers in so many different regions, so there will always be new updates to come with improved computing power and computational techniques and better representation of processes. Having said that, I do not think the picture will substantially change in future, though I can always be proved wrong, and the glaciers community are now at the stage of refining estimates for rates of mass loss.
Globally the loss of glaciers means sea level rise. Regionally and locally the biggest consequences will be for for water resources and we’re likely to see a local increase in natural hazards like outburst floods and avalanches that will need to be carefully managed. There have been a couple of instances already in the last year or two that probably demonstrate this well (e.g. the Marmolada glacier in Italy last year).
Sea level budget divided into components, from Legeais et al. 2018 ESSD The steric component is the expansion of sea water as it warms.
I include myself in the group who has to get used to the cultural shift. I have worked on glaciers in the Alps and Norway which are really rapidly disappearing. It’s kind of devastating to see, but it’s not actually surprising. We have known it was coming and in many cases (including the authors of this paper), measured the massive losses (last year, 2022 was a disaster for the Alps and both Fabien Maussion and Matthias Huss who are co-authors on the paper are running very comprehensive programmes that show in real time how much of a disaster) and predicted it with some accuracy. But we’re now at the point where it’s really undeniable that these glaciers are going fast.
#Glacier ice melt in 2022 was impressive! See the incredible speed of ice loss at the snout of Rhonegletscher (@VAW_glaciology time lapse by A. Cremona)…
The Rhonegletscher in the timelapse above is a really iconic glacier in the Alps, I have my own favourites, mostly places I’ve worked, like Norway, Iceland and Greenland, which are all to a greater or lesser extent retreating fast now. The glaciers that people consider iconic or at least well-known tend to be accessible and depend very much where you are and they will be the glaciers we mourn over in the next decades. In the French Alps, it’s probably the Mer de Glace, in Switzerland perhaps Rhone glacier or Plaine Morte (both have monitoring programmes), in Canada perhaps the Malaspina or Athabasca glaciers. There are still (just) glaciers on Kilimanjaro and Mount Kenya, the Ruwenzoris are basically gone, as are the Papuan glaciers.
Though they show in the study that ice loss is basically linear with temperature, at some point the glaciers become so small that the remianing melt is highly non-linear. And these won’t grow back under any sensible “overshoot” scenario (never mind that we don’t really have technology to remove carbon from the atmosphere at scale). Once they’re gone, they’re basically gone forever on human timescales Finally, I’d like to add a bit of anlaysis by Ben Marzeion and co-authors , it’s possible to basically put a number on the amount of melted glacier ice each kg of CO₂ leads to.
We find that under present-day climate conditions, every emitted kg of CO2 will eventually be responsible for a glacier mass loss of 15.8 (5.9–20.5) kg. Again, since the global glacier mass is decreasing with increasing temperatures, this number is greater for lower temperatures and smaller for higher temperatures.
I have been meaning to write about my return to field science (after 10 years mostly working on climate models) for the last 2 years, but prompted by this beautifully written piece in the Danish Newspaper information, I decided Christmas Day was the day (it for sure beats the washing up)…
“For at forstå, hvad der er ved at ske ved kloden, rejste vi mod isens ende” “To understand what is happening to the earth, we travelled to the end of the ice”
Martin Bahn og Anders Rye Skjoldjensen (foto) in Information 23rd December 2022
To make one thing very clear straight away, and as the newspaper article also makes very clear, my colleague Steffen Malskær Olsen has established and maintained a very long-running programme of observations in the fjord near Qaanaaq. This town in northern Greenland on the edge of a large fjord, and close to the North Water polynya has a uniquely interesting location to study and understand Arctic processes. The DMI facility there is long established and part of the INTERACT network of Arctic field stations. The 15-year record collected by Steffen is more or less unbroken and uniquely valuable. None of the science I’m planning to do or to work on would be possible without his dedication, hard work, insight and bridge building within the community in Qaanaaq. He and my other DMI colleagues involved in this programme are brilliant scientists and great field companions and I feel privileged to be able to work with them in this incredible place.
In the field: Steffen and team retrieving an oceanographic mooring with instruments on it after a winter out in the fjord in 2021.
Secondly, as the article also makes clear, scientists are not individualistic heroes who beat the odds, it’s a team sport. And it’s especially true in Greenland where the true heroes of this story are probably not scientists but the local hunters and fishers who guide and transport us and whose knowledge and experience is unmatched. I include also on this category our DMI colleague Aksel Ascanius who lives and works in Qaanaaq has been an essential part of the programme since the earliest days, as well as keeping other long-term observations in the network running in this part of the world.
Collaboration with the people who live in the Arctic has been essential for success in Arctic science since since the days of Franklin and Rae (for British readers) or Suersaq, aka Hans Hendrik, (after whom Hans Island is named) for Danes..
Anyway, back to the science of the present-day. DMI has progressively added more and more elements to the field laboratory in Qaanaaq in addition to the longer running observations. A non-exhaustive list would include an infrasound monitoring station that is part of the CTBTO, weather observations (of course), surface emissivity measurements by drone, fjord salinity, temperature and photosynthetically available radiation measurements plus snow and sea ice measurements as well as work with satellites and biology. One glaring omission, up to this year at least, was the glaciology of the region. How does the ice sheet affect the regional climate, how does the ocean affect the glaciers that calve into the fjord? Can we learn about some important but poorly understood processes like calving and melange dynamics using this area as a test bed? What about surface mass budget and snowfall and snow melt?
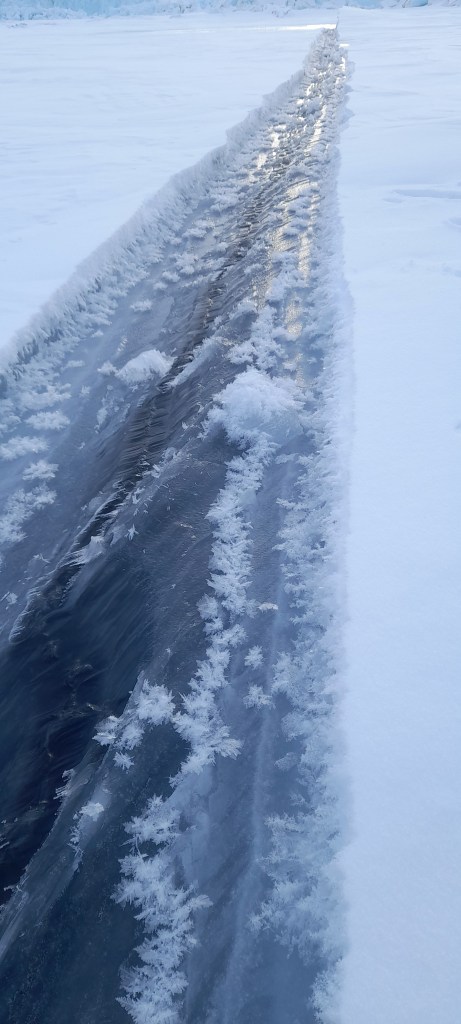
A lead in the sea ice – these fractures in the ice have sea water (the black) welling up between two thick plates of sea ice. The conditions were perfect for frost flowers to grow on the surface. Sea ice turns out to be a lot more interesting – and complex- than I’d ever imagined…
Now, as a glaciologist, I’ve mostly worked with the interface between atmosphere and ice sheet (at least the last 14 years or so, but I am also still (after my PhD topic on ice fracture and crevasses) interested in calving glaciers and the processes that control how fast icebergs form. And the fjord, Inglefield Bredning has *a lot* of calving glaciers in it. It is a natural laboratory for glaciology and for developing numerical models. Calving is actually a surprisingly difficult thing to model with computer models of glaciers.
Or perhaps it’s not that surprising?
Observations are difficult to get (to put it mildly). There are a number of (possibly wild) theories of “calving laws” that remain poorly constrained by observations as a result. Common parameterizations of ice flow makes it hard to deal with fast flowing glaciers where calving is common. Dealing with grounding lines, where glaciers meet the sea and start to come close to flotation can give notorious numerical errors and retreat requires the remaking of ocean grids in fully coupled climate models.
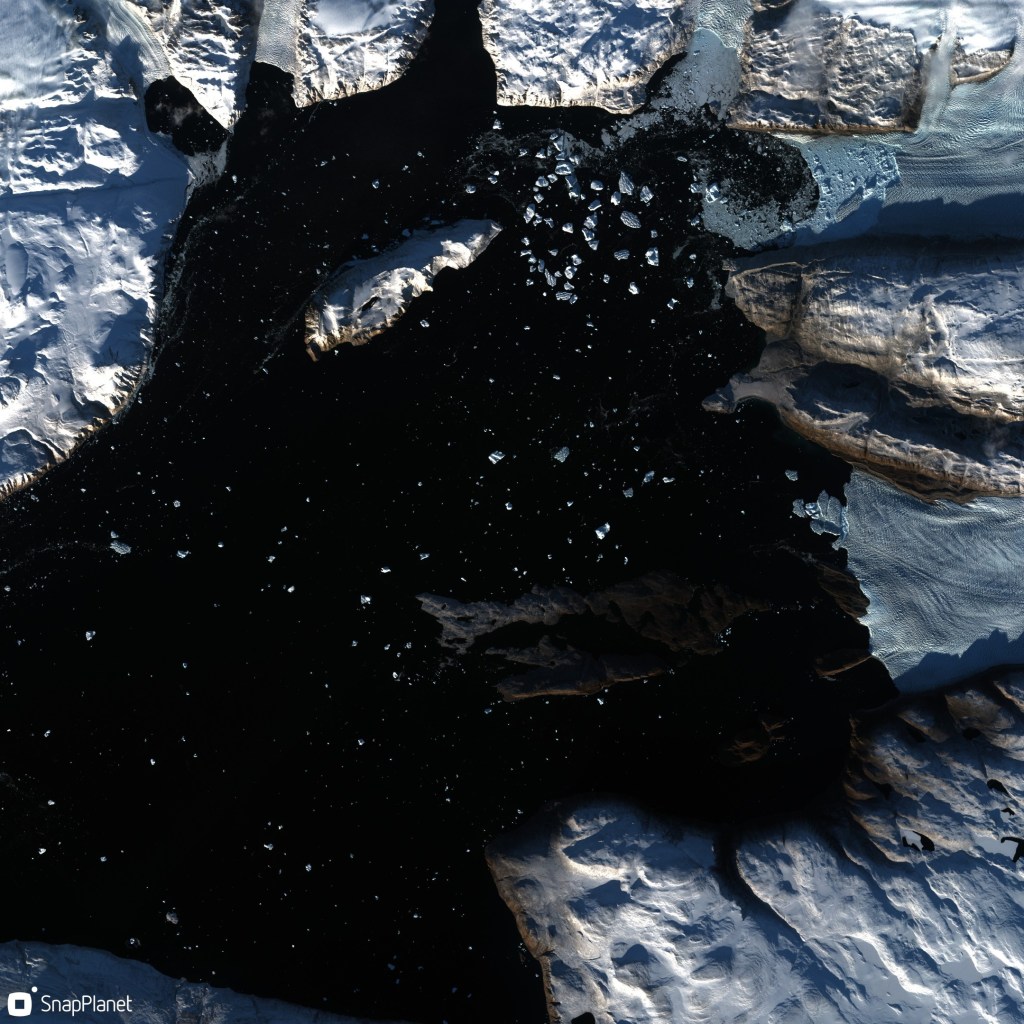
Satellite image from ESA’s Sentinel-2 satellite showing glaciers calving icebergs into the head of the Ingle field Bredning fjord. The black is open water, icebergs show up as blueish dots, the land is carpeted in snow. Low winter sun (in late September 2022) casts deep shadows.
These are not easy or computationally cheap problems to solve. And where there are at least thousands (maybe even tens of thousands?) of scientists working on atmospheric weather and climate modelling, the community working on ice sheet dynamic models is probably only in the low hundreds.
And of course, we really lack long time series of measurements – essential in a system that changes only s l o w l y, but likely irreversibly and which we are, only now as the system is changing rapidly, starting to understand.
This of course is why the fjord observation record of Steffen is so valuable – these are reliable, repeated measurements of ocean properties that are known to affect the outlet glaciers that meet them. It is indeed a natural laboratory.
What we are now also working on is a field lab to study these calving processes in-situ. I have already found the return to the field scientifically valuable. There is really no replacement for going to observe the earth system you want to understand. (My PhD supervisor used to call it “nurturing your inner glacier”). Observations taken in spring/summer 2022 have already changed how I think about some processes and hopefully the follow-up we have planned in 2023 will confirm our new theoretical framework.
Heading home from the deployment of instruments out near calving glaciers at the head of the fjord.
I am fortunate indeed in that at the same research department, we also have colleagues collecting and analyzing satellite data and developing the numerical models we want to use to understand how ice sheets fit into the earth system. All three of these elements – field, satellite and numerical model- are essential.
In this project we are using the satellite observations to extend the time series of field data and we can use both sets of observations together to develop and test a numerical model of this fjord and the glaciers that calve into it. The numerical model we can then extend to other glaciers in Greenland. Hopefully, we can also use this work to understand how Antarctic glaciers might also respond to a warming ocean. Ultimately, the aim of all this work is to understand the contribution of these glaciers to sea level rise both now and in the future.
This is not a frivolous question. In fact, if large (more than a couple of metres).of sea level rise is expected, it is a question that is basically existential for Denmark.
I will add more on the specifics and science in coming months, this is already long enough. However, I’d like to mention a couple of other points:
Firstly, DMI is by no means alone operating up here. Many of the key articles, particularly on glaciology in this region, have been written by the Japanese group at Hokkaido University and their collaborators at the Meteorological Research Institute, the national institute for polar research and others. We at DMI are also working directly with the Greenland institute of natural resources, Asiaq, GEUS, KU, DTU, AU, SDU, ESA, Eumetsat and many others in this research programme.
Finally, this work is currently being carried out under the auspices of the Danish National Centre for Climate Research (NCKF), funded by the Danish Government though with contributions also from other research projects mostly funded by the EU’s Horizon 2020 and Horizon Europe frameworks as well as ESA’s climate change initiative for the Greenland ice sheet.
Although I’ve had an account on mastodon since 2017 it’s only since the great Twitter migration that I’ve been using it and – I like it! (You can find me there as @ruth_mottram@fediscience.org )
I definitely don’t see it as a like-for-like replacement to twitter, what I miss from the bird site (as the denizens of the fediverse refer to it) is the breaking news (though even that seems to be under threat). However, when it comes to useful information, new tools, papers, in-depth discussions on scientific interests, Mastodon is winning every time, certanly compared to twitter now. It reminds me very much of how the birdsite was in the early days (though I’ve only been on since around 2011). It requires a bit more work to find the good stuff, and I may write something about that soon.
Anyway, an interesting discussion arose this weekend that I want to document and book mark here. Last week at work, our research group had a discussion about subscriptions and literature searches, specifically in relation to the costs of Web of Science, google scholar and connected papers.
Screenshot of an example search on connectedpapers.com where a paper looking at ice melange at Sermeq Kujalleq (Jakobshavn Isbræ) is the starting point
Back on mastodon and suddenly the suggestions came pouring in! In particular Nika Shilobod has some intriguing suggestions visit the link to click on them all.
In Mastodon you can bookmark posts, so I have saved this one for future reference as I start to build a reference library looking at ice melange for my next paper. The issue has an extra relevance as the extortionate fees that publishers charge libraries is now starting to have real effects even in rich countries like Denmark where we were recently warned that we may lose full access even to very high profile journals Nature unless some reasonable agreement can be made between the universities and the publisher. (This article in the guardian is particularly eye-opening on how we got here!)
As a result I found these particularly useful links:
So all of this pretty much confirms my initial impression of mastodon, and indeed the fediverse in general – there’s an enormous amount of good stuff out there, and this seems liek a really good way to find it.
On the 16th may 1619 two ships, the Unicorn and the Lamprey, set sail from Copenhagen searching for the fabled North West Passage. On board there were 65 men, led by their captain, the Danish explorer Jens Munk. A year and a half later, the Lamprey limped back into Bergen (Norway) with just 3 men, including Munk, on board.
Almost all of the other crew members had died of scurvy in Hudson Bay .
The story of this terrible voyage, their sailing round Iceland, Greenland, Baffin Bay and into Hudson Bay is outlined in this wonderful atmospheric podcast from DR.
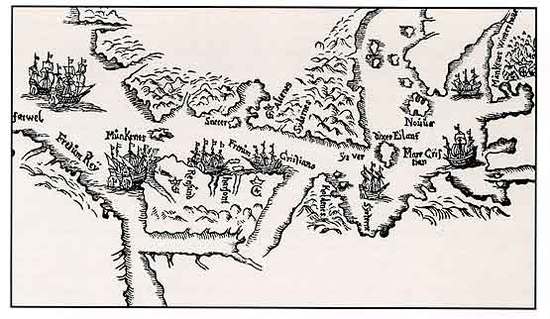
A Map, hand-drawn by Jens Munk in 1624 of the area between Cape Farewell and Hudson Bay, seen from the north; (Source: Tromsø University library)
The UK has similarly many tales of Arctic and Antarctic suffering, listening to the podcast I was put in mind of Coleridge’s famous “Rime of the Ancient Mariner”, but we rarely hear of the similar stories from other nations, a clear benefit of learning other languages is being able to access these archives and stories*.
The podcast contains a wonderful description by a Greenland pilot of the sea ice and how tricky navigating it can be along with interviews and inputs from many others. If you are at all familiar with Danish – I really recommend the series.
However, the description by a nutritionist of the terrible effects of scurvy had me wondering. I learn (via Dutch family and confirmed by the OED) that the name of the disease, caused of course by a lack of vitamin C in the diet, is probably from the Dutch Scheurbuik – rip belly – an eloquent description of one of the notable later stages of the disease.
Rip here is less a description of enhanced musculature and much more a description of what it feels like when your internal organs start to bleed and your muscles and bones are weak from lack of nutrition.
Photo of chest cage with pectus excavatum and scorbutic rosaries – from this paper
Upon looking it up (Thankyou Wikipedia), I learn that the causes of scurvy had been repeatedly identified, forgotten and mistaken since at least the middle Ages. There is an estimate that around 2 million sailors died as a result of scurvy between 1500 and 1800.
2 Million almost entirely preventable deaths and 2 million men who died in appalling agony.
And this happened in spite of what appears to be the first recorded medical trial by James Lind in the 1750s, it still took the Royal Navy 40 years to start giving out fresh citrus fruits as a standard on their ships. Vitamin C itself was only finally recognised and extracted in 1932.
This story is an outrage in many ways, but a clear example also of how science and medicine, properly conducted, can help to improve and save lives. It is also a clear warning to conduct thoughtful experiments with care and to listen to those warnings when they have been issued.
It might also be a recommendation that learning foreign languages is not only fun and useful but can be it’s own reward.
*I should also mention here that the rather awesome Danish Arctic Institute are currently producing a very well written series on Danish exploration in the Arctic in English, based on their own very comprehensive podcast series. These are published online in the Arctic Journal. Both the series of historical accounts and the newspaper in general are absolute top recommends for those interested in the subject of the Arctic environmentally , socially and politically.
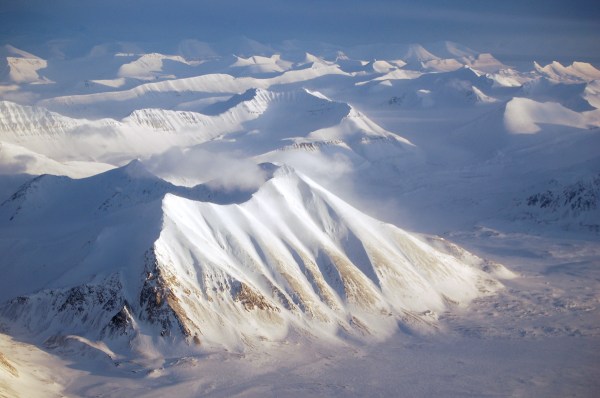
The lure of the poles (Svalbard in Spring, the coldest time of year)
Extract from “Rime of the Ancient Mariner” by Samuel Taylor Coleridge